Difference between revisions of "ISSS608 2017-18 T3 Assign Manu George Mathew Q3"
Jump to navigation
Jump to search
(Created page with "<div style=background:#ae946e border:#ae946e> 165px <b><font size = 6; color="#FFFFFF"> VAST Challenge 2018:Suspense at the Wildlife Preserve </f...") |
|||
| Line 60: | Line 60: | ||
<tr> | <tr> | ||
<td><b> 2.Does the group composition change during the course of their activities? </b> | <td><b> 2.Does the group composition change during the course of their activities? </b> | ||
| − | <br> | + | <br> |
</td> | </td> | ||
| − | <td>[[File: | + | <td>[[File:mgm_Q3_1|500px|center]]</td> |
</tr> | </tr> | ||
| Line 74: | Line 74: | ||
<td> | <td> | ||
[[File:mgm_Q3_11.jpg|500px|center]] | [[File:mgm_Q3_11.jpg|500px|center]] | ||
| + | |||
| + | The communication Trend is visualized as shown. | ||
| + | [[File:mgm_Q3_12.jpg|500px|center]] | ||
</td> | </td> | ||
</tr> | </tr> | ||
Revision as of 00:03, 9 July 2018
|
|
|
|
|
|
|
|
Question:
Using the combined group of suspected bad actors you created in question 2, show the interactions within the group over time.
Visualization and Analysis
| Description | Illustration |
|---|---|
| 1.Characterize the group’s organizational structure and show a full picture of communications within the group
|
|
| 2.Does the group composition change during the course of their activities?
|
|
|
3.How do the group’s interactions change over time?
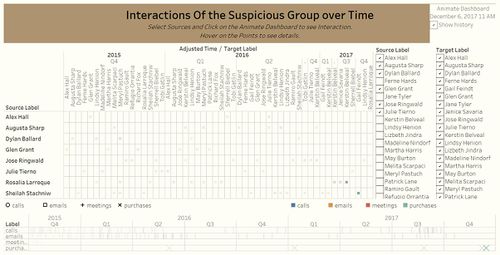
By using the dashboard provided, we can analyse the group's interactions over time.
|
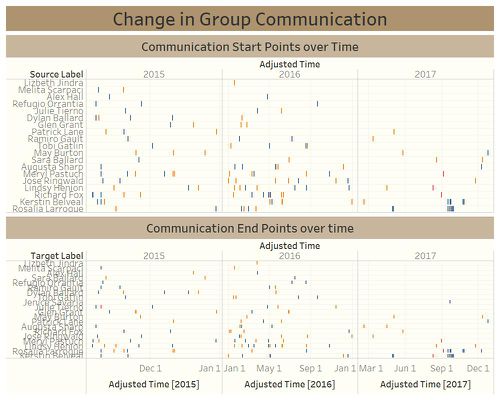
The communication Trend is visualized as shown. |
Links and Guide to Dashboard
View the interactive Tableau design here:Link to tableau dashboard
Insights
By using the above Plots, we can infer that,
- Richard Fox still remains the most well connected person of the Group as he was contacted in 2017 by the new group of people.


