ISSS608 2017-18 T3 Assign Manu George Mathew Q1
|
|
|
|
|
|
|
|
Question:
Using the four large Kasios International data sets, combine the different sources to create a single picture of the company. Characterize changes in the company over time. According to the company’s communications and purchase habits, is the company growing?
Visualization and Analysis
| Description | Illustration |
|---|---|
|
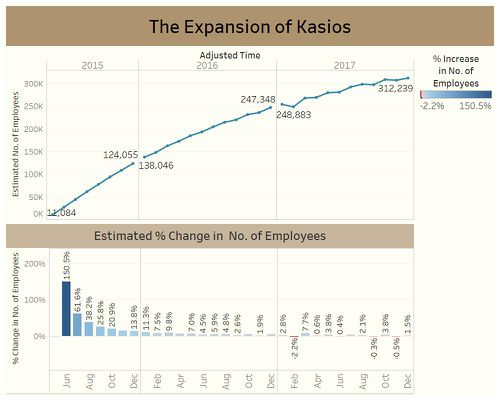
1.The expansion of Kasios
|
|
|
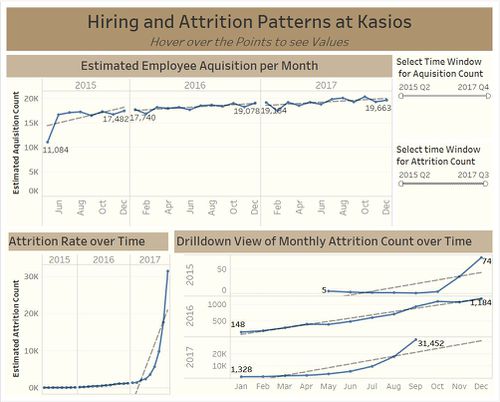
2.Hiring and Attrition Patterns at Kasios
|
|
|
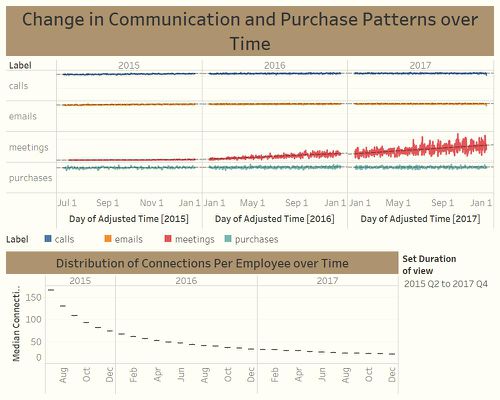
3.Change in Communication and Purchase patterns over Time
|
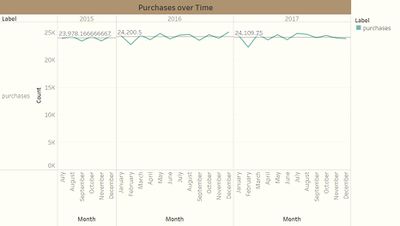
Purchases over Time: |
Links and Guide to Dashboard
The Dashboard's data size exceeded limits of Tableau Public. Thus it is currently stored in OneDrive. Please Download and Extract the Same. It is available at this link
Insights
By using the above dashboards, we can infer that,
- The company has been hiring at a steady pace since May 2015 based on the employee count.
- But looking at the attrition count , more and more employees seem to be leaving the company over time.
- On the communications front, There is an increasing trend in meetings over time.
- The number of connections for a typical employee at Kasios have been getting smaller and smaller over time. this could show that the company is growing at a pace in which the teams are getting more isolated from each other


