Difference between revisions of "ISSS608 2017-18 T3 Assign Vishali Reddy Nalla"
(Created page with "<!--title--> <div style='background:#1976D2'> <table border=0 width=100%><tr> <td width=40%>250px</td> <td><font size=5 color="#FFFFFF">VAST Challenge 201...") |
|||
| (33 intermediate revisions by the same user not shown) | |||
| Line 1: | Line 1: | ||
| − | + | ||
| − | <div style= | + | <div style=background:#FCBA12 border:#D4EDF7 > |
| − | + | [[Image:Picture1_Vi.jpg|400px]] | |
| − | + | <font size = 5; span style="font-family:Georgia; color:#343009"> VAST Mini Challenge 2 – Like a Duck to Water </font> | |
| − | |||
| − | |||
</div> | </div> | ||
| − | + | <!--MAIN HEADER --> | |
| − | + | {|style="background-color:#F7E7D4;" width="100%" cellspacing="0" cellpadding="0" valign="top" border="0" | | |
| + | |||
| + | | style="font-family:Georgia; font-size:100%; solid #343009; background:#F7E7D4; text-align:center;" width="16%" | | ||
| + | ; | ||
| + | |||
| + | [[ISSS608_2017-18_T3_Assign_Vishali_Reddy_Nalla| <font color="#343009"><big><big> Introduction </big></big></font>]] | ||
| + | |||
| + | | style="font-family:Georgia; font-size:100%; solid #343009; background:#F7E7D4; text-align:center;" width="16%" | | ||
| + | ; | ||
| + | |||
| + | [[ISSS608_2017-18_T3_Assign_VISHALI_REDDY_NALLA - Data Preparation| <font color="#343009">Data Preparation</font>]] | ||
| + | |||
| + | | style="font-family:Georgia; font-size:100%; solid #343009; background:#F7E7D4; text-align:center;" width="16%" | | ||
| + | ; | ||
| + | [[ISSS608_2017-18_T3_Assign_VISHALI_REDDY_NALLA - Visualisations| <font color="#343009">Visualisations</font>]] | ||
| + | |||
| + | | style="font-family:Georgia; font-size:100%; solid #343009; background:#F7E7D4; text-align:center;" width="16%" | | ||
| + | ; | ||
| + | [[ISSS608_2017-18_T3_Assign_VISHALI_REDDY_NALLA - Insights| <font color="#343009">Insights</font>]] | ||
| + | |||
| + | | style="font-family:Georgia; font-size:100%; solid #343009; background:#F7E7D4; text-align:center;" width="16%" | | ||
| + | ; | ||
| + | [[ISSS608_2017-18_T3_Assign_VISHALI_REDDY_NALLA - Conclusion| <font color="#343009"> Conclusion </font>]] | ||
| + | |||
| + | | style="font-family:Georgia; font-size:100%; solid #343009; background:#F7E7D4; text-align:center;" width="16%" | | ||
| + | ; | ||
| + | [[Assignment_Dropbox_G2| <font color="#343009"> Assignment Dropbox </font>]] | ||
| − | + | | | |
| − | |||
| − | |||
| − | |||
| − | |||
| − | |||
| − | |||
| − | |||
| − | |||
| − | |||
|} | |} | ||
| + | {| class="wikitable" | ||
| + | |- | ||
| + | __NOTOC__ | ||
| + | |||
<br> | <br> | ||
| + | =1. Overview = | ||
| + | |||
| + | Mistford is a mid-size city located to the southwest of the Boonsong Lekagul Wildlife Preserve. The city has a small industrial area with four light-manufacturing endeavors. Mistford and the wildlife preserve are struggling with the possible endangerment of the Rose-Crested Blue Pipit, a locally loved bird. The bird’s nesting pairs seem to have decreased alarmingly, prompting an investigation last year implicating Kasios Office Furniture, a Mistford manufacturing firm. Kasios Office Furniture manufactures metal and composite-wood office furniture including desks, tables, and chairs. Kasios wants to do with desk chairs what Starbucks did for coffee – making office furniture what people must have, instead of what they just need. “Office equipment doesn’t need to be ugly!” says founder Ken Kasios. | ||
| + | |||
| + | But last year, the Kasios Furniture Company was implicated in environmental damage to the Boonsong Lekagul Wildlife Preserve for both dumping toxic waste and polluting the air with chemicals from its manufacturing process. But Kasios is not taking these accusations lying down, and they deny any accusation of industrial waste dumping! Kasios’ spokespersons state that there isn’t any ground contamination near the remote ranger station and they have inspected that area and found it as pristine as the rest of the preserve. | ||
| + | |||
| + | Outraged professors from Mistford College journeyed to investigate this further by collecting several years of water sensor readings from rivers and streams in the preserve. These samples were taken from different locations scattered throughout the area and contain measurements of several chemicals of possible interest. | ||
| + | |||
| + | With the data collected from water sensors of the several chemicals, I used Visual Analytics to explore the details of the chemical contamination in the Boonseng Lekagul Waterways. | ||
| + | |||
| + | = 2. Objective = | ||
| + | |||
| + | [[Image:Picture3_Vi.png|200px|right]] | ||
| + | To investigate the hydrology data from across the Boonsong Lekugul Wildlife Preserve and to answer the following Vast Challenge 2018 Mini-Challenge 2 questions | ||
| + | |||
| + | 1) Characterize and observe the trend of chemical contamination in the Boonsong Lekagul Waterways with respect to past and most recent situation. | ||
| + | |||
| + | 2) Identify the anomalies in the waterway samples and how it poses a threat to environment? Is the Hydrology Department collecting sufficient data to understand the comprehensive situation across the Preserve? | ||
| + | |||
| + | 3) Does this cause any particular concern for the Pipit or other Wildlife? | ||
| + | |||
| + | =3. Methodology = | ||
| + | |||
| + | The small steps of my journey as a Visual Detective to study the chemical contamination in the wildlife Preserve is as shown below - | ||
| + | |||
| + | [[Image:Picture2 Vi.png|800px]] | ||
| + | |||
| + | <u>Tools Used</u> - Tableau , Microsoft Excel | ||
| − | + | Join me through my journey as I investigate the Chemical Contamination in the Boonsong Lekagul Waterways!! | |
| − | + | ---- | |
| − | |||
| − | |||
| − | |||
| − | |||
| − | |||
| − | |||
| − | |||
| − | |||
| − | |||
| − | |||
Latest revision as of 23:15, 8 July 2018
|
|
|
|
|
|
|
1. Overview
Mistford is a mid-size city located to the southwest of the Boonsong Lekagul Wildlife Preserve. The city has a small industrial area with four light-manufacturing endeavors. Mistford and the wildlife preserve are struggling with the possible endangerment of the Rose-Crested Blue Pipit, a locally loved bird. The bird’s nesting pairs seem to have decreased alarmingly, prompting an investigation last year implicating Kasios Office Furniture, a Mistford manufacturing firm. Kasios Office Furniture manufactures metal and composite-wood office furniture including desks, tables, and chairs. Kasios wants to do with desk chairs what Starbucks did for coffee – making office furniture what people must have, instead of what they just need. “Office equipment doesn’t need to be ugly!” says founder Ken Kasios.
But last year, the Kasios Furniture Company was implicated in environmental damage to the Boonsong Lekagul Wildlife Preserve for both dumping toxic waste and polluting the air with chemicals from its manufacturing process. But Kasios is not taking these accusations lying down, and they deny any accusation of industrial waste dumping! Kasios’ spokespersons state that there isn’t any ground contamination near the remote ranger station and they have inspected that area and found it as pristine as the rest of the preserve.
Outraged professors from Mistford College journeyed to investigate this further by collecting several years of water sensor readings from rivers and streams in the preserve. These samples were taken from different locations scattered throughout the area and contain measurements of several chemicals of possible interest.
With the data collected from water sensors of the several chemicals, I used Visual Analytics to explore the details of the chemical contamination in the Boonseng Lekagul Waterways.
2. Objective
To investigate the hydrology data from across the Boonsong Lekugul Wildlife Preserve and to answer the following Vast Challenge 2018 Mini-Challenge 2 questions
1) Characterize and observe the trend of chemical contamination in the Boonsong Lekagul Waterways with respect to past and most recent situation.
2) Identify the anomalies in the waterway samples and how it poses a threat to environment? Is the Hydrology Department collecting sufficient data to understand the comprehensive situation across the Preserve?
3) Does this cause any particular concern for the Pipit or other Wildlife?
3. Methodology
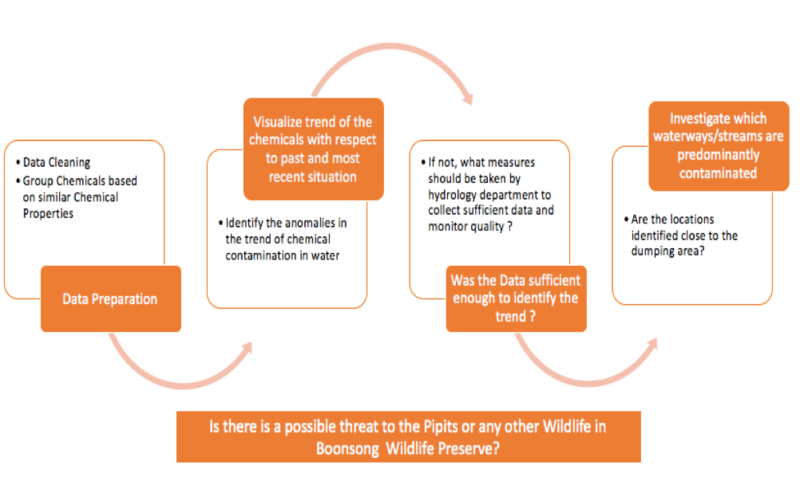
The small steps of my journey as a Visual Detective to study the chemical contamination in the wildlife Preserve is as shown below -
Tools Used - Tableau , Microsoft Excel
Join me through my journey as I investigate the Chemical Contamination in the Boonsong Lekagul Waterways!!


