Difference between revisions of "MU FUYAO Questions-answer"
| Line 36: | Line 36: | ||
</tr> | </tr> | ||
<tr> | <tr> | ||
| − | <td><b> 1. | + | <td><b> 1.Year 1998---2007 </b> |
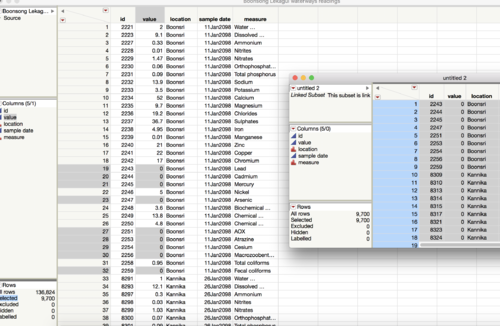
| + | <br>There are some measures having value of 0, I can’t decide whether the measurement is 0 or didn’t have measure. So, I regard it as missing value and delete. | ||
| + | |||
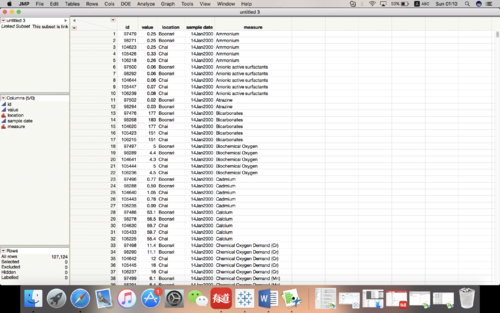
| + | There are some strange values in this dataset. For same location, same time and same measure, but there are different values. I think it’s repetitive value. So, I get average of them. | ||
| + | |||
| + | </td> | ||
| + | <td>[[File: Missing value.png|500px|center]] | ||
| + | |||
| + | [[File:Repetitive data.png|500px|center]]</td> | ||
| + | </tr> | ||
| + | |||
| + | <tr> | ||
| + | <td><b> 1.Year 2008---2016 </b> | ||
<br>There are some measures having value of 0, I can’t decide whether the measurement is 0 or didn’t have measure. So, I regard it as missing value and delete. | <br>There are some measures having value of 0, I can’t decide whether the measurement is 0 or didn’t have measure. So, I regard it as missing value and delete. | ||
Revision as of 20:23, 8 July 2018
|
|
|
|
|
Question 1
Characterize the past and most recent situation with respect to chemical contamination in the Boonsong Lekagul waterways. Do you see any trends of possible interest in this investigation?
| Statement | Graph |
|---|---|
| 1.Year 1998---2007
There are some strange values in this dataset. For same location, same time and same measure, but there are different values. I think it’s repetitive value. So, I get average of them. |
|
| 1.Year 2008---2016
There are some strange values in this dataset. For same location, same time and same measure, but there are different values. I think it’s repetitive value. So, I get average of them. |


