Difference between revisions of "ISSS608 2017-18 T3 Assign Vaishnavi Praveen Agarwal Vast"
| Line 89: | Line 89: | ||
Readings for Artificial Chemical's like <b>Anionic active surfactants</b>, <b>Adsorbable Organic Halides (AOX)</b> and <b>Methylosmoline</b> reaches peak over the last few years (2010-2016). | Readings for Artificial Chemical's like <b>Anionic active surfactants</b>, <b>Adsorbable Organic Halides (AOX)</b> and <b>Methylosmoline</b> reaches peak over the last few years (2010-2016). | ||
*<b>Anionic active surfactants</b> have increased approximately by 13% in <b>Boonsri</b> and 45% in <b>Kohsoom</b>. | *<b>Anionic active surfactants</b> have increased approximately by 13% in <b>Boonsri</b> and 45% in <b>Kohsoom</b>. | ||
| − | *<b>Adsorbable Organic Halides (AOX)</b> average value has increased from 0 (in 2009) to 27 (in 2016) in <b>Kohsoom</b> and from 0 (in 2009) to 15 (in 2016) in <b>Boonsri<b>. | + | *<b>Adsorbable Organic Halides (AOX)</b> average value has increased from 0 (in 2009) to 27 (in 2016) in <b>Kohsoom</b> and from 0 (in 2009) to 15 (in 2016) in <b>Boonsri</b>. |
*<b>Methylosmoline</b> average value has increased from 6 (in 2015) to 58 (in 2016) in <b>Kohsoom</b> and from 4 (in 2015) to 130 (in 2016) in <b>Somchair</b>. | *<b>Methylosmoline</b> average value has increased from 6 (in 2015) to 58 (in 2016) in <b>Kohsoom</b> and from 4 (in 2015) to 130 (in 2016) in <b>Somchair</b>. | ||
| + | The Artificial chemicals are results of industrial waste therefore, with this we can say that these places have high industrial waste contamination. | ||
<div style="margin:0px; padding: 2px; font-family: Arial; border-radius: 1px; text-align:left"> | <div style="margin:0px; padding: 2px; font-family: Arial; border-radius: 1px; text-align:left"> | ||
| Line 110: | Line 111: | ||
|} | |} | ||
</div> | </div> | ||
| − | |||
=<span style="color:red">Question-2:</span> What anomalies do you find in the waterway samples dataset? How do these affect your analysis of potential problems to the environment?= | =<span style="color:red">Question-2:</span> What anomalies do you find in the waterway samples dataset? How do these affect your analysis of potential problems to the environment?= | ||
Revision as of 16:16, 8 July 2018
|
|
|
|
|
|
|
Contents
Question-1: Characterize the past and most recent situation with respect to chemical contamination in the Boonsong Lekagul waterways.
1. Direct Relation between Calcium and Total Hardness
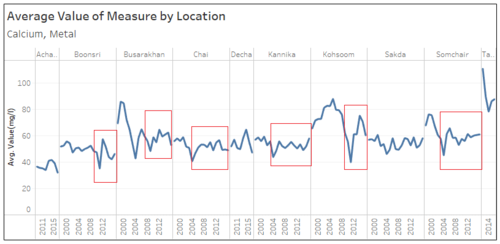
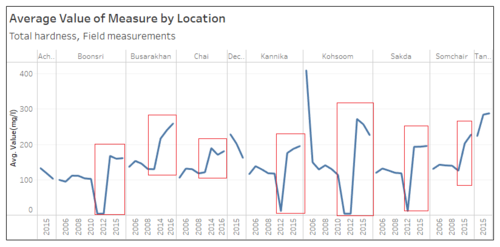
Water Hardness is the amount of dissolved Calcium and other metals ions in water. A good level of hardness in water is <120 mg/l. Based on the data, it is seen that the concentration of Calcium increases after 2012 in all the places. Also, the levels of Total Hardness increased in all the places after 2012. Therefore, similar trend for these two measures is seen. Also, both of these measures are high in Tansene and Kohsoom.
2. Inverse Relation between Total Phosporous and Dissolved Oxygen
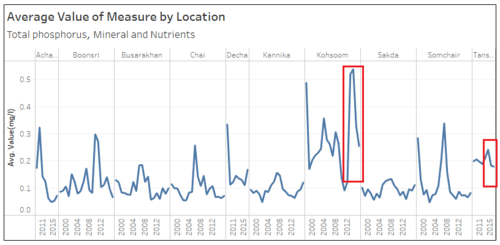
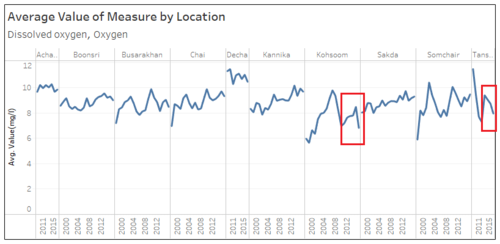
Just as we need air to breathe, aquatic organisms need dissolved oxygen to respire. It is necessary for the survival of fish, invertebrates, bacteria, and underwater plants. Low dissolved oxygen (DO) primarily results from excessive algae growth caused by Phosphorus. Phosphorus is an essential element for plant life, but when there is too much of it in water, it can speed up eutrophication. The maximum level of Phosporous is 0.03 mg/l. From the graphs below, it is seen that the Total Phosphorous levels are high for Kohsoom and Tansene for the last two years as compared to other places. And, the levels of Dissolved Oxygen have decreased in these two places for the last two year, and its the least compared to other places.
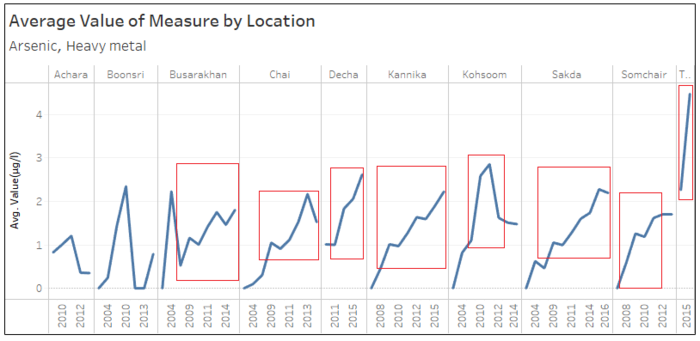
3. Increase in Arsenic Concentration
The concentration level of Arsenic increased in all the places after 2009. Arsenic can enter the water supply majorly from industrial pollution. Which gives a reason to claim that the industrial waste has increased over the years.
4. Increase in Artificial Chemical's Concentration
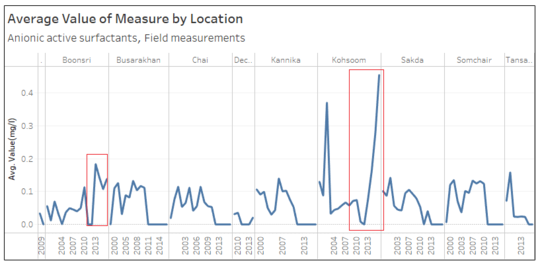
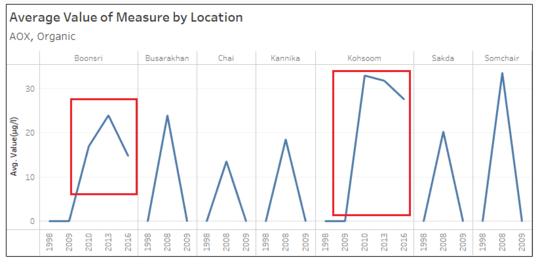
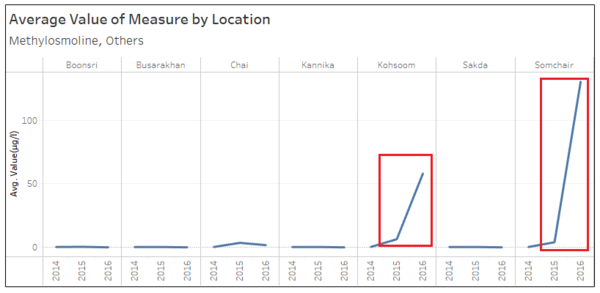
Readings for Artificial Chemical's like Anionic active surfactants, Adsorbable Organic Halides (AOX) and Methylosmoline reaches peak over the last few years (2010-2016).
- Anionic active surfactants have increased approximately by 13% in Boonsri and 45% in Kohsoom.
- Adsorbable Organic Halides (AOX) average value has increased from 0 (in 2009) to 27 (in 2016) in Kohsoom and from 0 (in 2009) to 15 (in 2016) in Boonsri.
- Methylosmoline average value has increased from 6 (in 2015) to 58 (in 2016) in Kohsoom and from 4 (in 2015) to 130 (in 2016) in Somchair.
The Artificial chemicals are results of industrial waste therefore, with this we can say that these places have high industrial waste contamination.
Question-2: What anomalies do you find in the waterway samples dataset? How do these affect your analysis of potential problems to the environment?
1. Abnormal Data Collection Pattern for Hydrocarbons
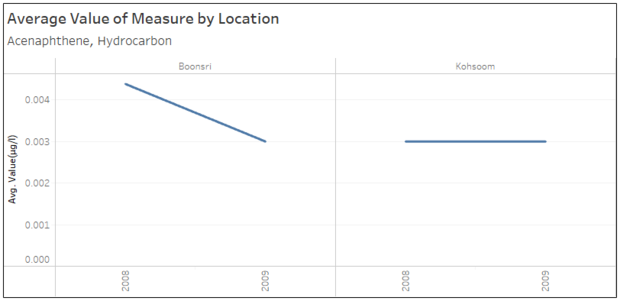
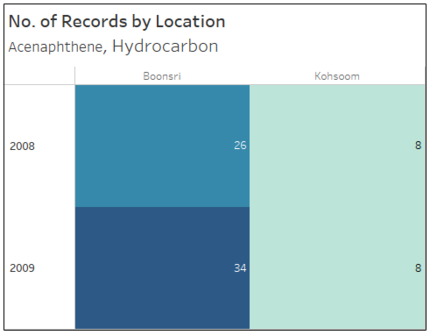
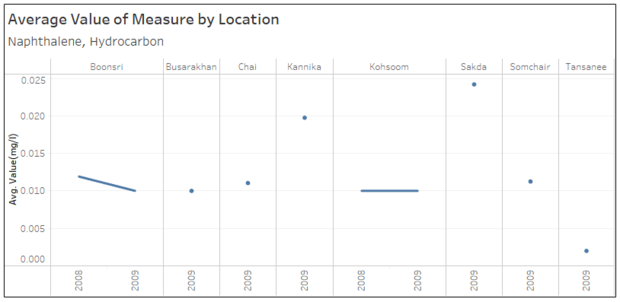
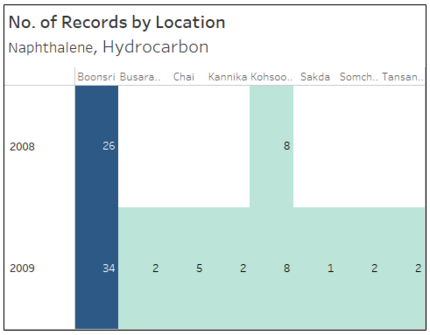
Earlier, while preparing the data I grouped measures like Benzo(a)pyrene, Chrysene, Acenaphthene, PAH's and others as Hydrocarbons. After, grouping the data I noticed that the data recording pattern for these measures were also similar:
- The readings for these measures were taken only for years between 2007-2009.
- The number of readings taken in Boonsri were three times more than number of readings for any other place.
- The average value of readings was high in those years.
Because of this, I was not able to examine the trend of these measures, and cannot find if they pose any potential threat to the environment.
2. Readings for Cyanide in 2010 and 2011
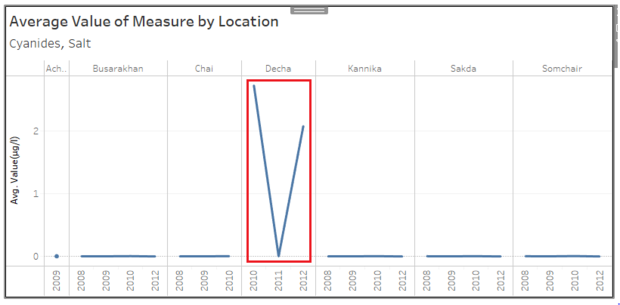
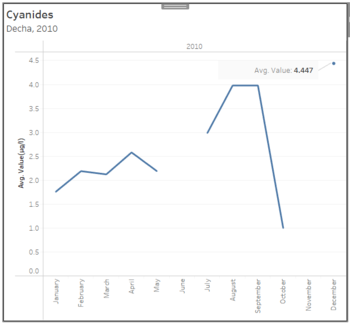
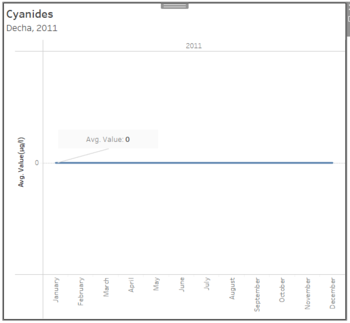
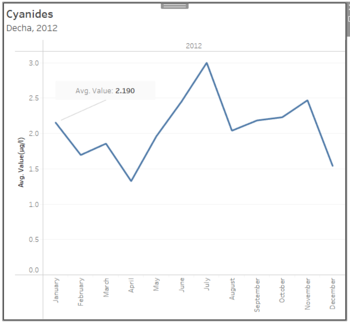
The readings for Cyanide in Decha were taken only for 2010, 2011 and 2012. The visualization shows that the readings are very high in 2010 and 2012, but its 0 in 2011. For detailed analyses, I drill down to month-wise readings of each and found the following:
- The reading taken for December 2010 was 4.4 µg/l.
- The reading for year 2011 was 0 for all the months.
- The reading for January 2012 was 2.15 µg/l.
Based on the reading, I think the data for year 2011 was not recorded properly.

