Difference between revisions of "ISSS608 2017-18 T3 Assign NEVIL BRUNO Data Prep"
| Line 37: | Line 37: | ||
<font size = 3; color="#000000"><span style="font-family:Trebuchet MS; font-weight:bold;"><h2>Data</h2></span></font> | <font size = 3; color="#000000"><span style="font-family:Trebuchet MS; font-weight:bold;"><h2>Data</h2></span></font> | ||
</div> | </div> | ||
| − | For our analysis, the following datasets are at our disposal:<br> | + | For our analysis, the following datasets are at our disposal:<br><br> |
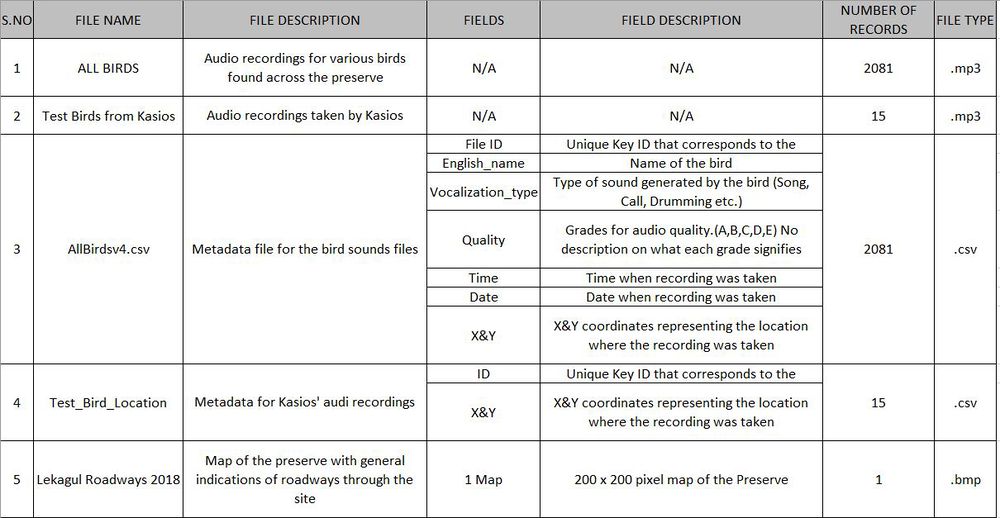
| − | + | [[File:Nevil_Data_Table.JPG|1000px|]] | |
<br> | <br> | ||
<div style=" text-align:left"> | <div style=" text-align:left"> | ||
Revision as of 20:18, 7 July 2018
|
|
|
|
|
|
|
|
Data
For our analysis, the following datasets are at our disposal:

Tools Used
For the data prep, analysis, and visualizations, the following tools will be used:
1. SAS JMP Pro 13
2. Microsoft Excel
3. Tableau Desktop: Professional Edition
4. R Studio
- plotly
- tuneR
5. Microsoft Paint
6. Photo to GIF: GIF Maker
Data Prep
On initial exploratory data analysis, we find that there are no issues with the MP3 files and map. For the CSV files, there are format issues in the date and time fields. We can use SAS JMP to recode these values to a standard format. For the dates, we will be using the dd/mm/yyyy format. For time, we use the 24-hour format.
There are no format issues with the File IDs, Bird names, Quality scores, X&Y coordinates for both files. For missing values, we will be excluding them from the analysis.
Preliminary EDA gives us the following insights:
1. There are 19 unique bird species. Out of the 2081 records, 186 are of the Rose-Crested Blue Pipit
2. The Vocalization type is mainly ‘Songs’ and ‘Calls’
3. There are 5 levels for audio quality: A, B, C, D, E. In the next section, we will analyse the audio samples to determine what each grade signifies.
4. There are very few recordings pre-2007. There is also lack of data in 2018.
5. Most of the recordings took place during the morning (06:00 to 12:00)
6. Number of pipit recordings have a significant number post 2009.
7. Looking at the overall data at monthly level granularity, it can be observed that the number of birds for most of the months is very low. Apart from this, there are a lot of months which have no recordings.
Map Prep
The map provided is a 200 X 200 .bmp image of the reserve. For analysing patterns and anomalies on across the Preserve, the map can be imported into tableau:
We are also provided with coordinates for the dumping ground (148,159). For our analysis, we would require an area around the point. A square 20 X 20 area centred around the dumping ground can be created. The coordinates for the square are as follows:
- TOP LEFT: (128,179)
- TOP RIGHT: (168,179)
- BOTTOM LEFT: (128,139)
- BOTTOM RIGHT: (168,139)
This area can be used to determine if the dumping site affects the bid scatter across the preserve.
Final Decisions & Assumptions before Analysis
1.2018 data is not a sign of decline in numbers, it is the lack of data recorded during this time which translates to the low numbers.
2.Due to the lower numbers pre-2007, we will be excluding them from the analysis. We will be keeping our analysis time-period from 2007-2017 inclusive.
3.Due to irregularities at monthly level data, the analysis will be kept at a yearly level.
4.The 20 X 20 area marked on the map is the zone that is affected by the dumping at point (148,159).
