ISSS608 2017-18 T3 Assign NEVIL BRUNO Q2
|
|
|
|
|
|
|
|
Contents
Question 2
Kasios now claims that last year's analysis was flawed and biased. To combat these conclusions, Kasios has launched their own “investigation” into the Pipit situation, and they are now reporting that there are plenty of Rose-crested Blue Pipits happily living and nesting in the Preserve. To back up this claim, they have provided a set of Pipit bird calls, recently recorded across the Preserve, with locations of where they were recorded. Clearly, they claim, the Pipits are a thriving population. Using R, we will be taking a closer look at the audio recordings provided by Kasios and validating their claims.
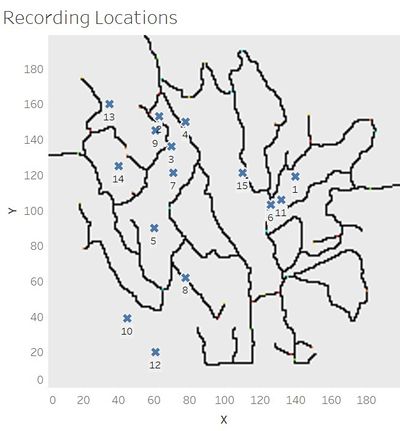
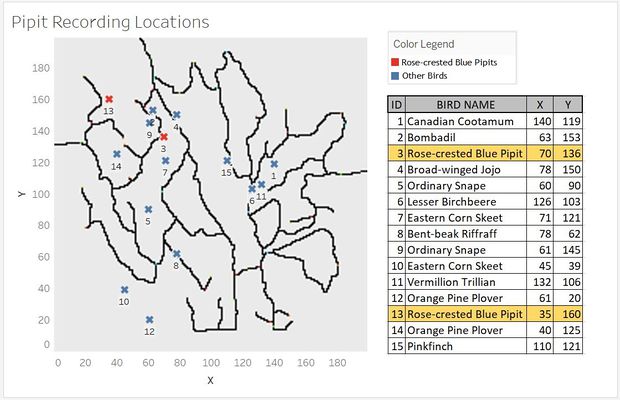
Kasios claims all the recordings taken across the preserve are of Rose-crested Blue Pipits. They have provided 15 recordings taken across different parts of the preserve. Each recording has a unique File ID from 1 to 15. The locations of each recording are given below:
For our analysis, we will be using R to plot the audio files and do a visual analysis to determine various characteristics.
Determining Vocalization Type and Best Audio Quality
Song or Call
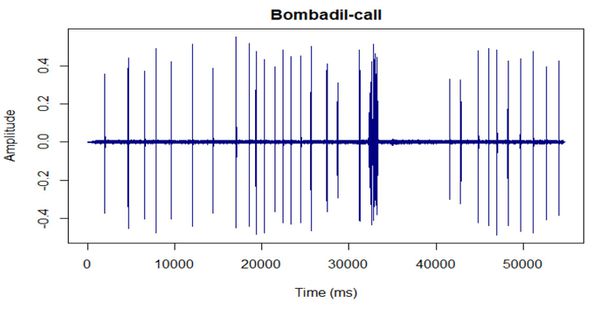
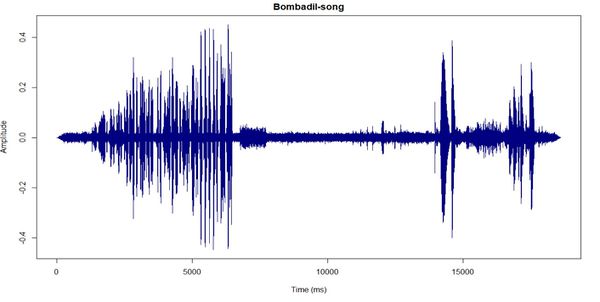
Fortunately, we have recordings of every bird species. For our analysis, we will be comparing the Kasios audio files to the Bird audio files to validate Kasios’ claims. As discovered in our initial EDA, there are 2 main vocalization types and 5 levels of audio quality. It is essential that the same vocalization type and best quality audio files be used for the analysis. We first take a sample for call and song for the same bird. In this case, we will use the Bombadil (chosen at random). A call and song of the same quality level (Quality A, chosen at Random) is taken and compared.
Visually inspecting both plots, for Song type audio files, we obtain distinct patterns (better amplitude and better spaced audio tones) which will assist us in our analysis.
Determining Quality
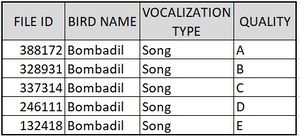
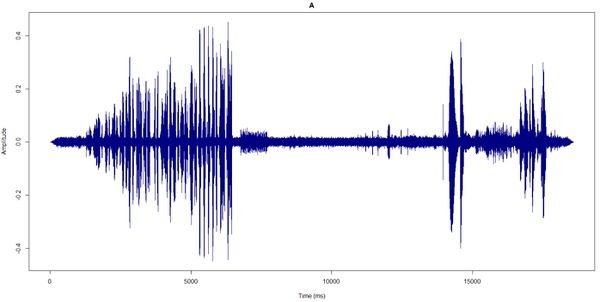
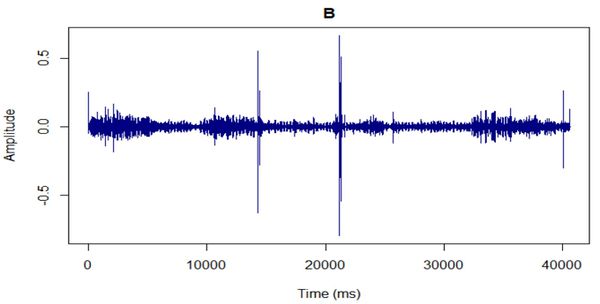
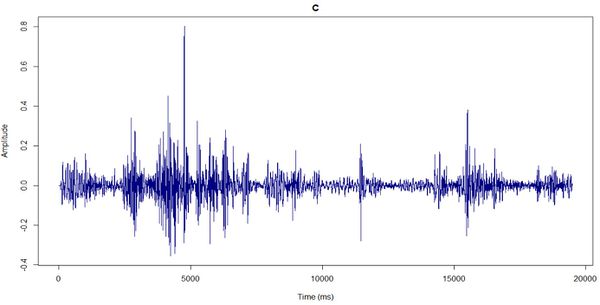
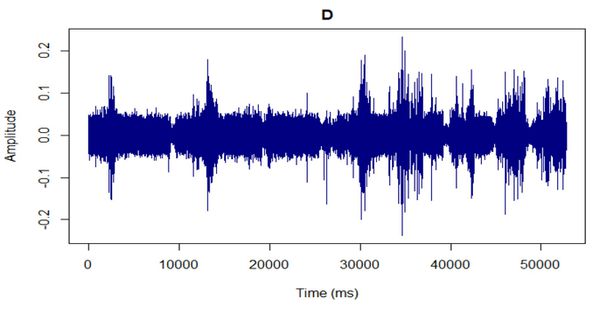
An analysis on the 5 different audio qualities will be done to determine which grade represents the best audio quality. To perform this, we would require the same bird. We will be using 5 different audio quality files of the Bombadil Song files (chosen at random).
The audio plots for each type are given below:
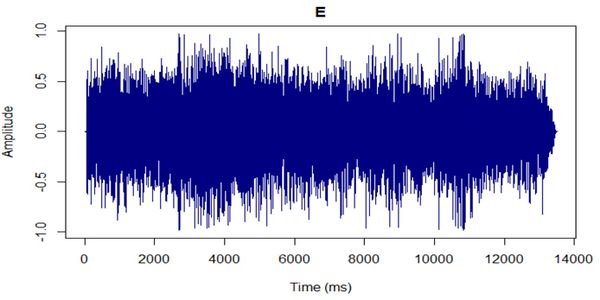
From a visual and audio inspection, D and E are more distorted, and have lower SNR compared to the other 3. B has low amplitude values, which means the sound volume level will be low. Comparing A and C, we get more distinct and clearer audio waveform patterns for A. This is essential for our analysis. Hence, we can rule our B, C, D and E from the analysis and take audio quality A for our analysis.
Obtaining Plots for Audio Files
Bird Species Files
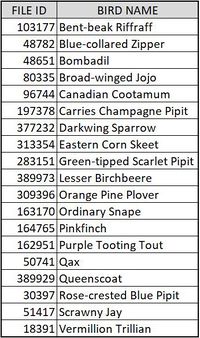
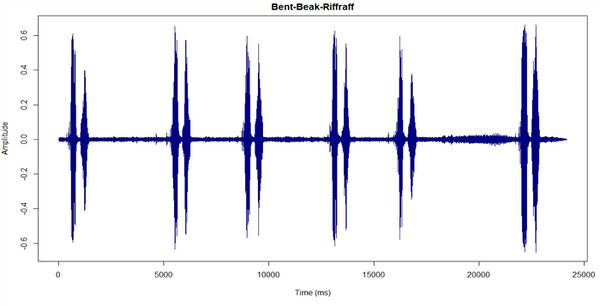
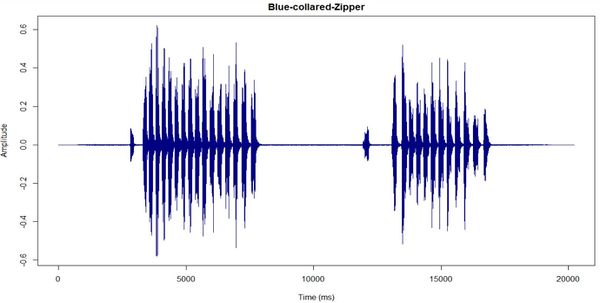
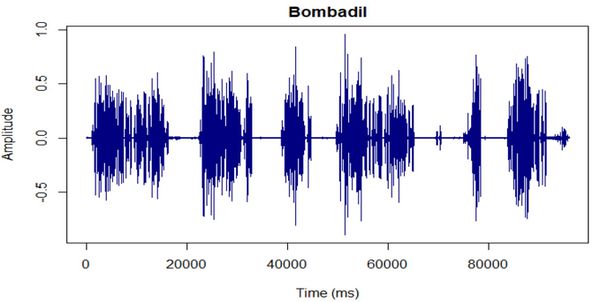
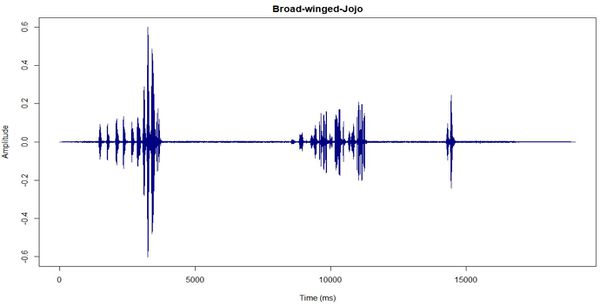
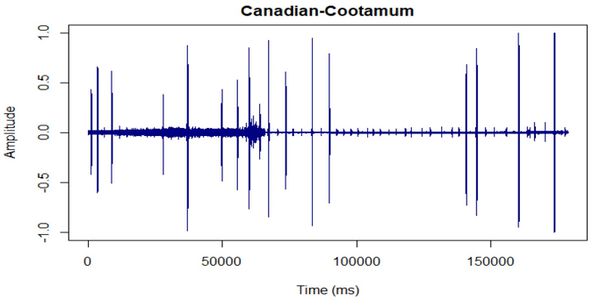
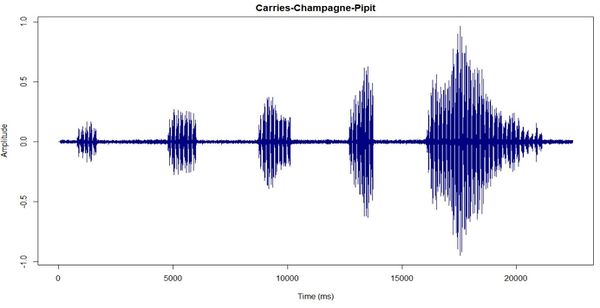
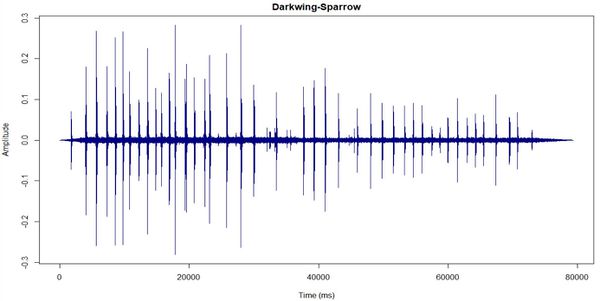
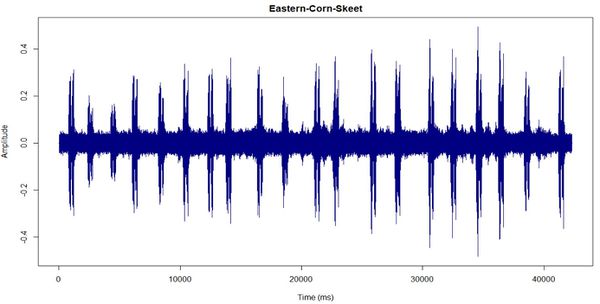
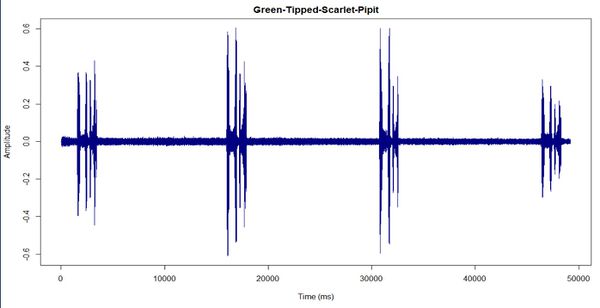
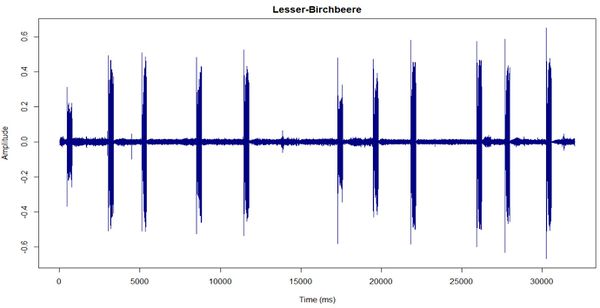
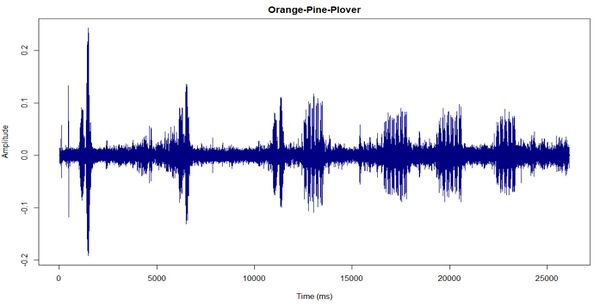
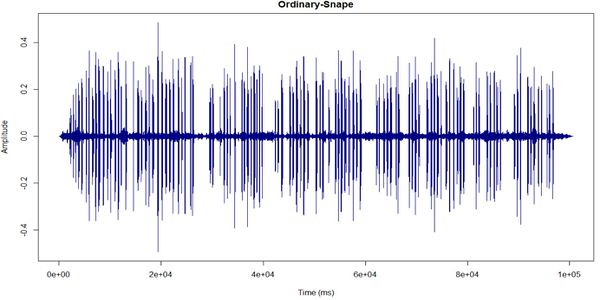
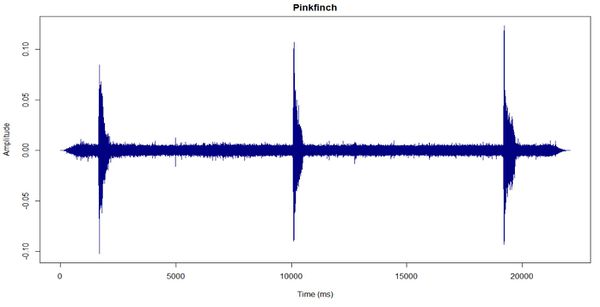
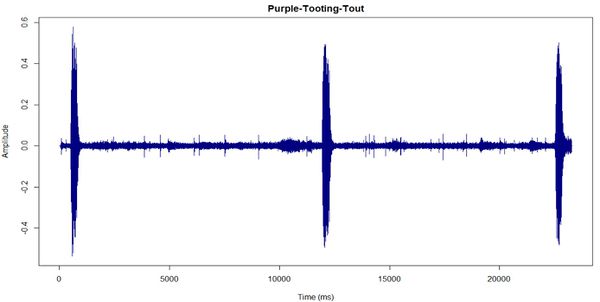
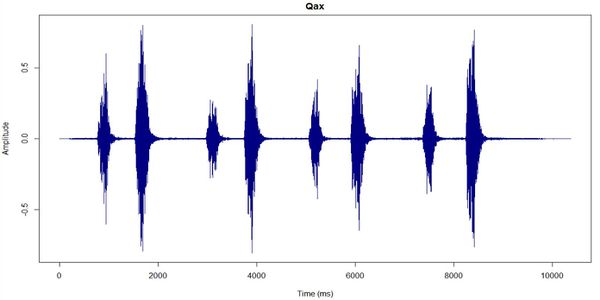
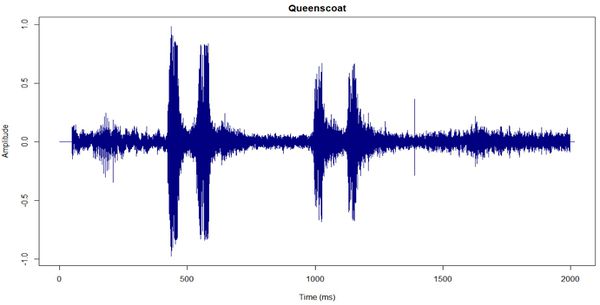
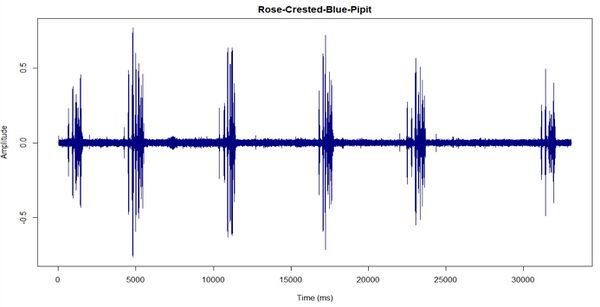
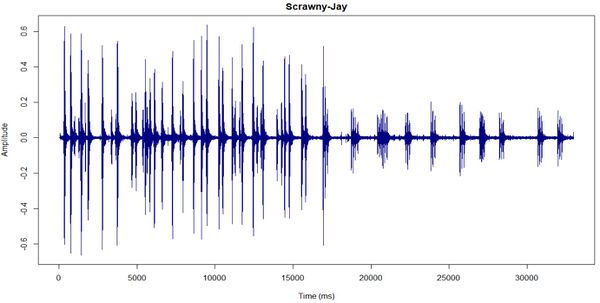
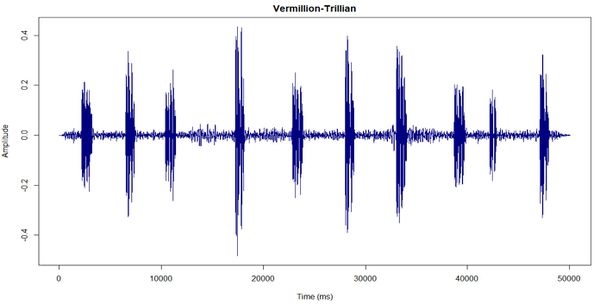
Audio for the 19 different bird species are taken and plotted. Vocalization type Song and Quality level A is taken for each bird. Each file was selected randomly. These same plots will be used for our visual comparison analysis
1. Bent-beak Riffraff
2. Blue-collared Zipper
3. Bombadil
4. Broad-winged Jojo
5. Canadian Cootamum
6. Carries Champagne Pipit
7. Darkwing Sparrow
8. Eastern Corn Skeet
9. Green-tipped Scarlet Pipit
10. Lesser Birchbeere
11. Orange Pine Plover
12. Ordinary Snape
13. Pinkfinch
14. Purple Tooting Tout
15. Qax
16. Queenscoat
17. Rose-crested Blue Pipit
18. Scrawny Jay
19. Vermillion Trillian
Kasios Files
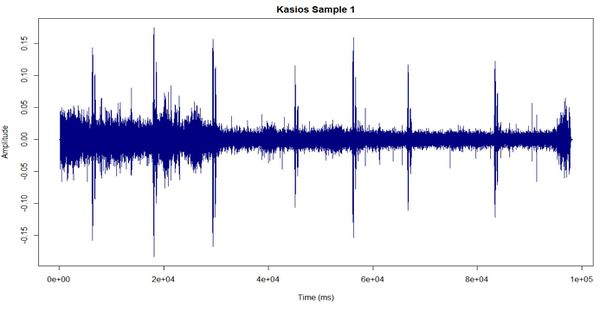
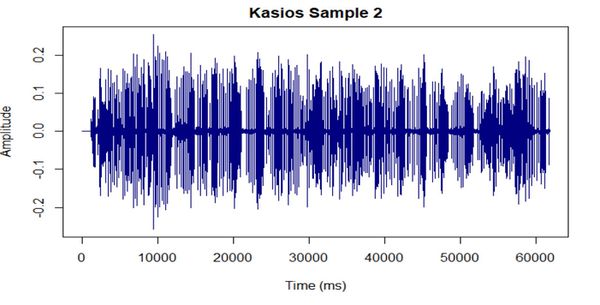
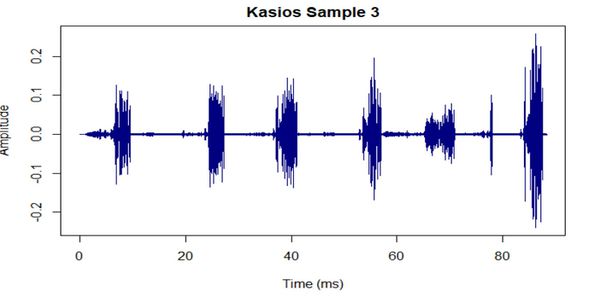
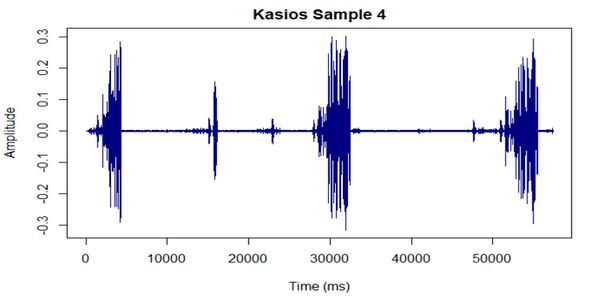
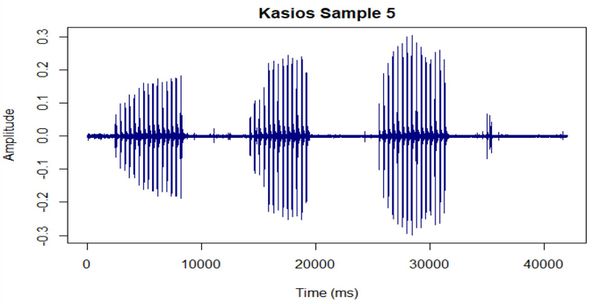
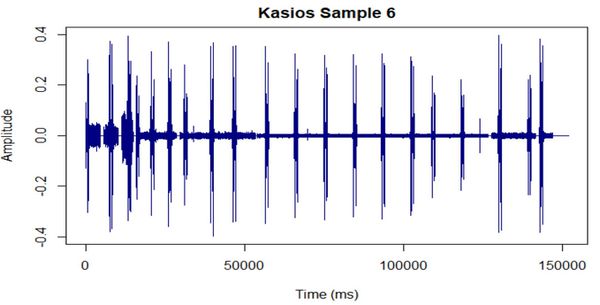
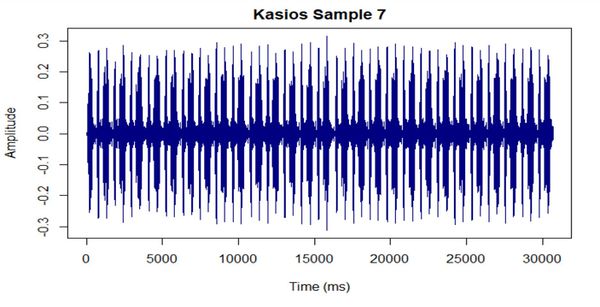
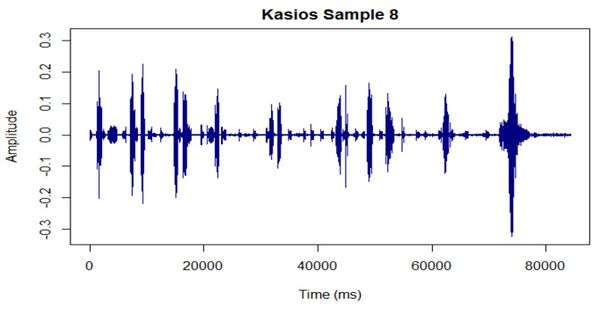
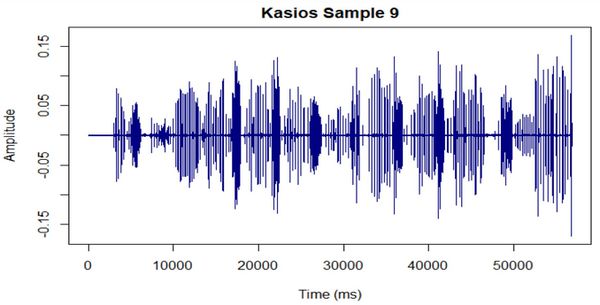
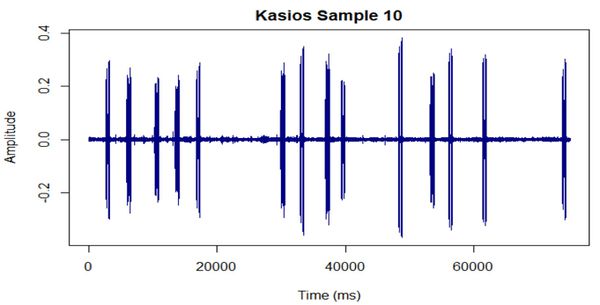
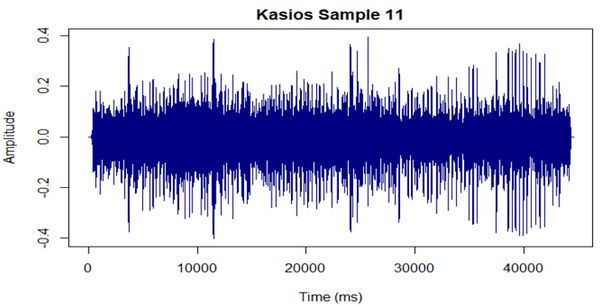
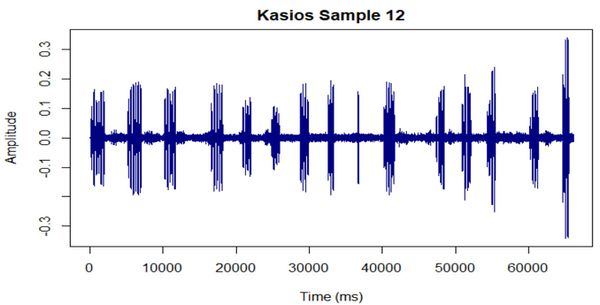
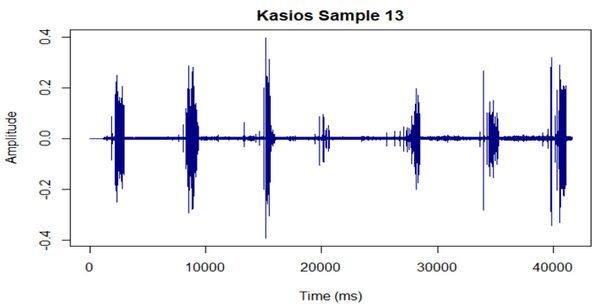
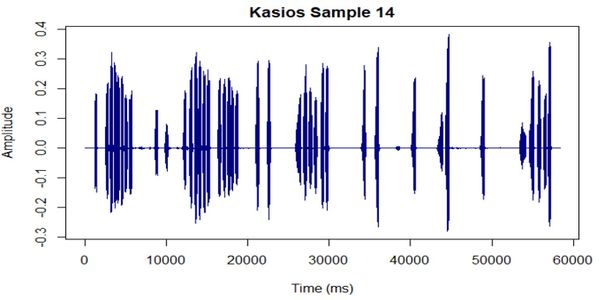
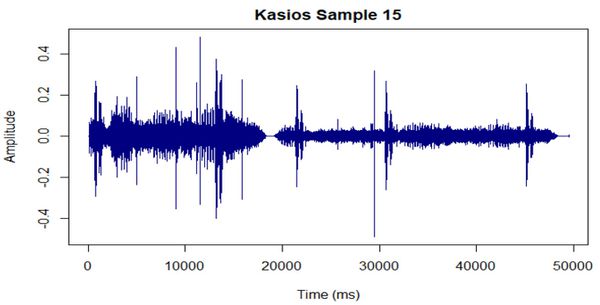
Audio for the 15 audio samples provided by Kasios are taken and visualized.
Sample 1
Sample 2
Sample 3
Sample 4
Sample 5
Sample 6
Sample 7
Sample 8
Sample 9
Sample 10
Sample 11
Sample 12
Sample 13
Sample 14
Sample 15
Comparision of Audio Files
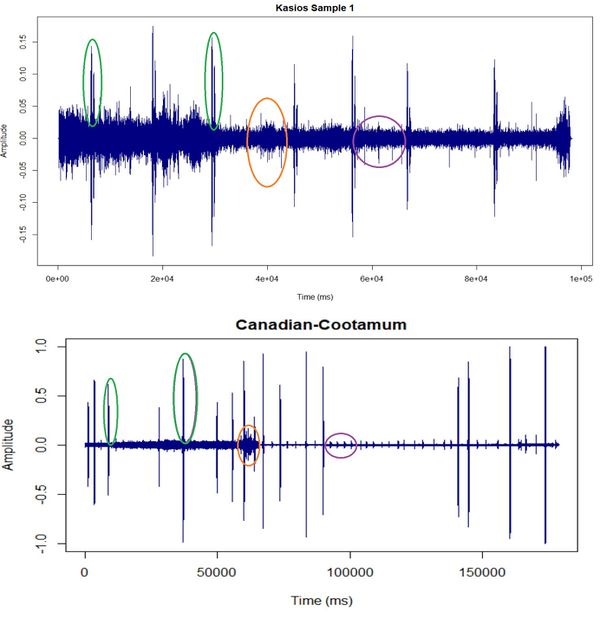
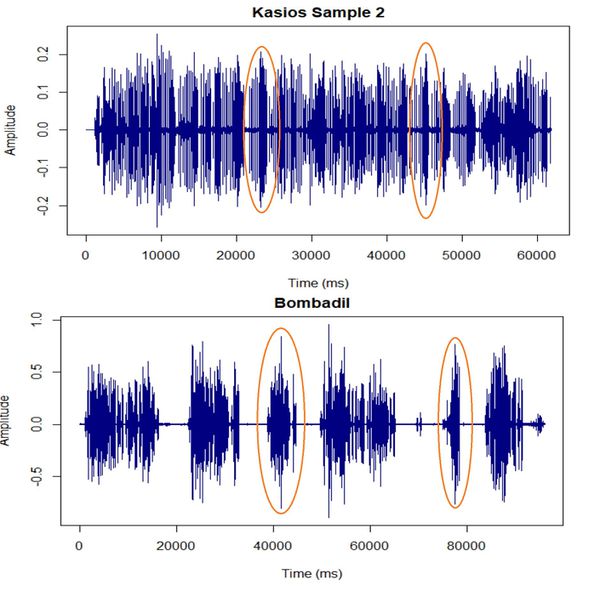
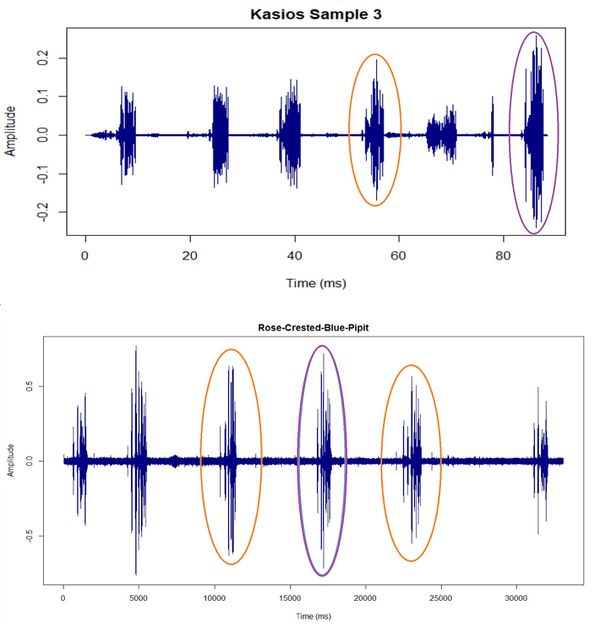
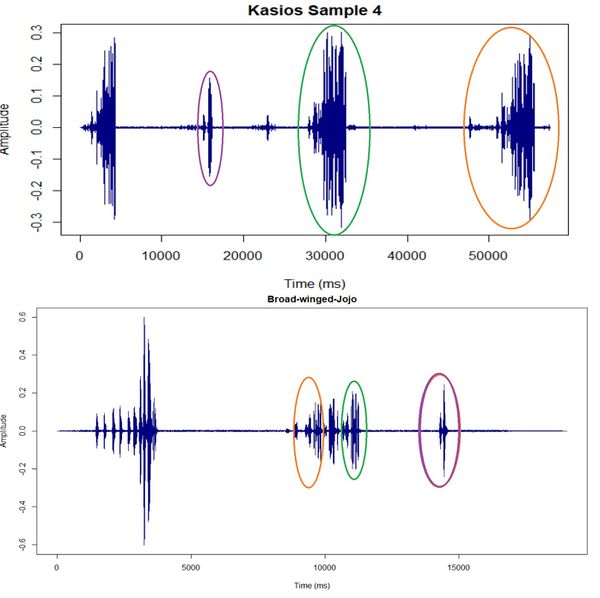
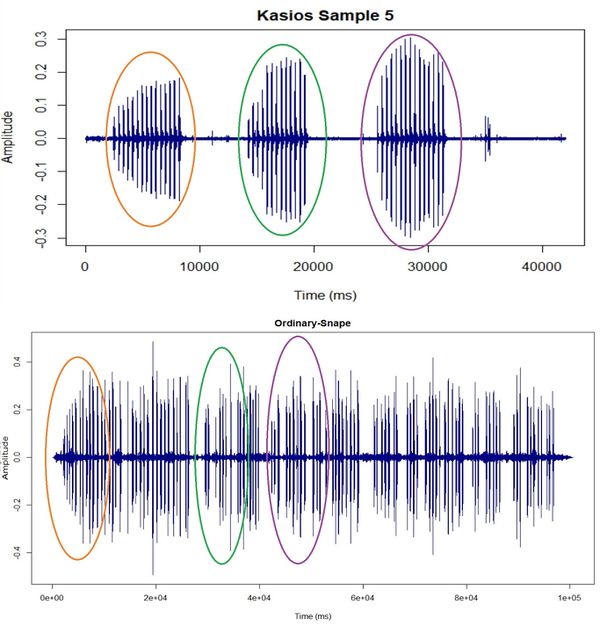
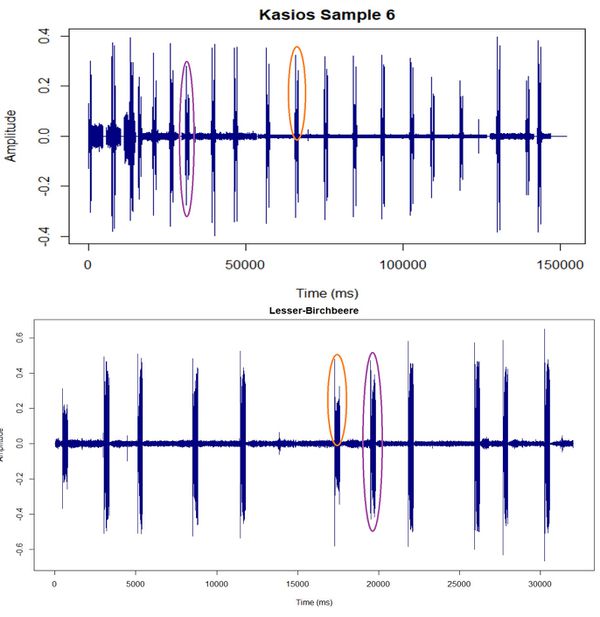
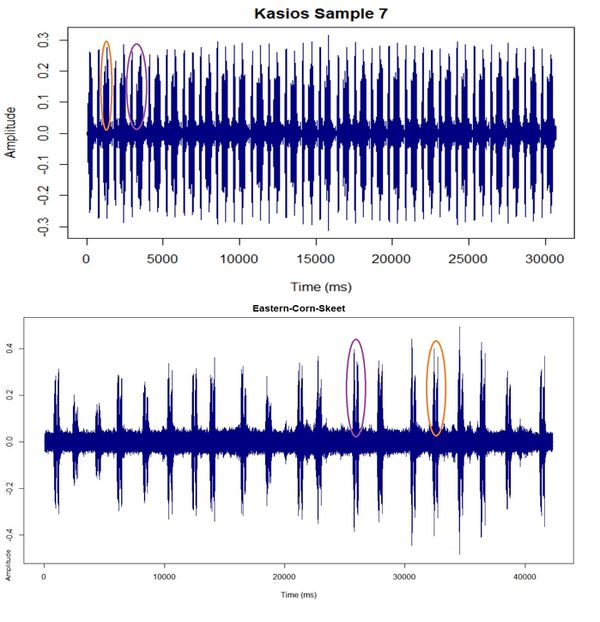
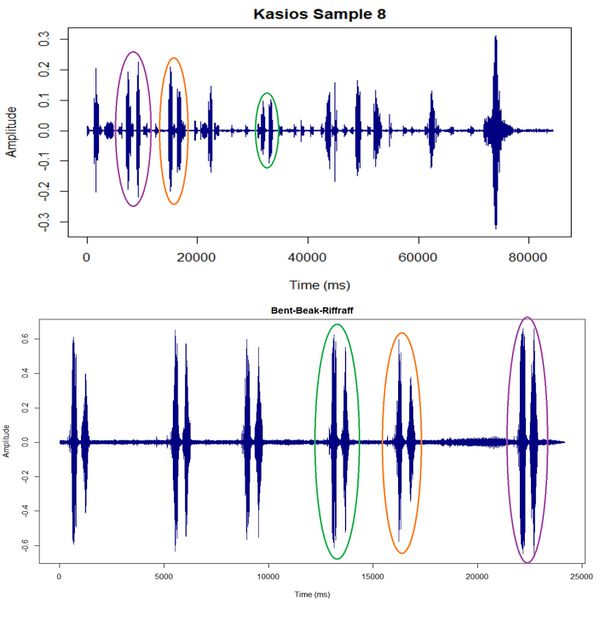
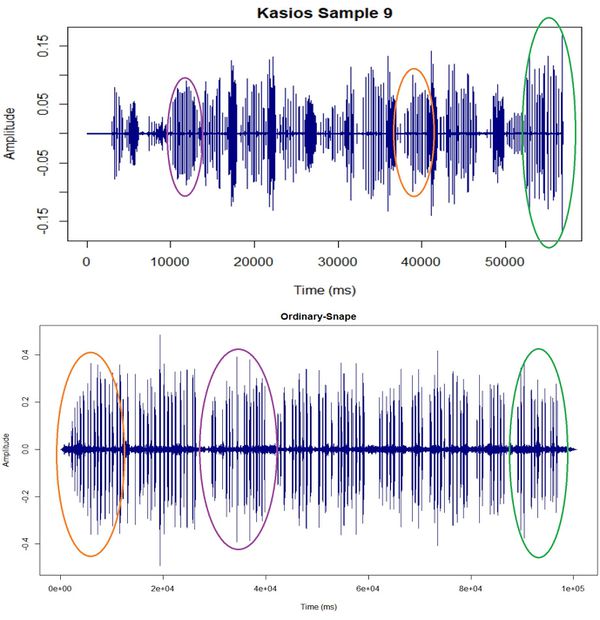
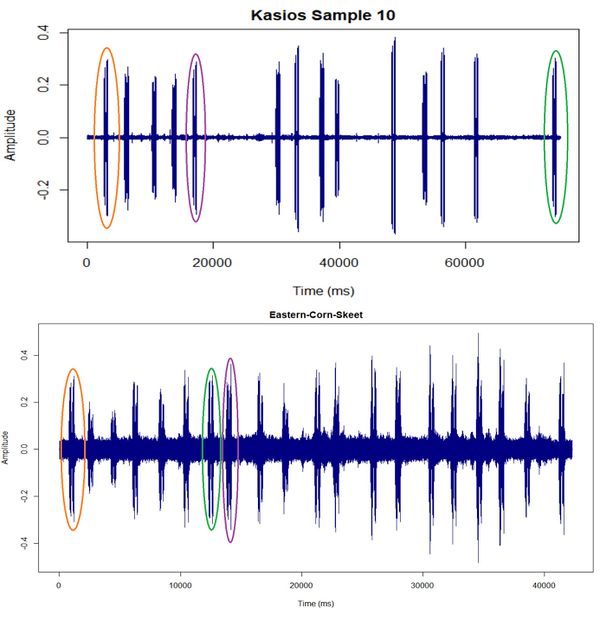
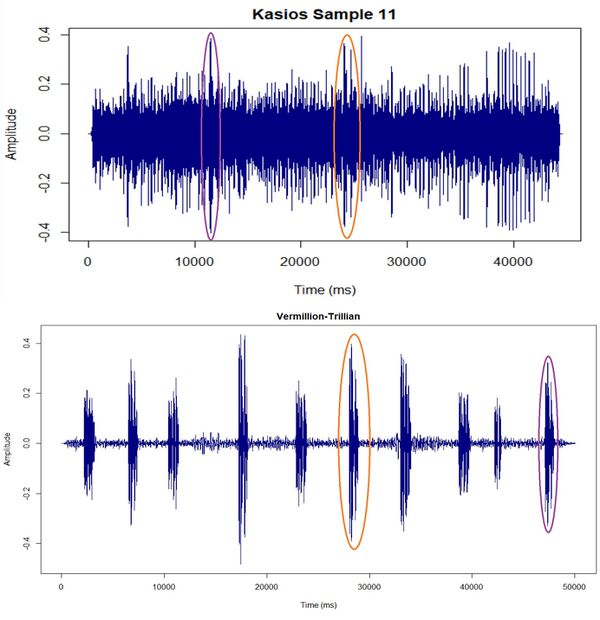
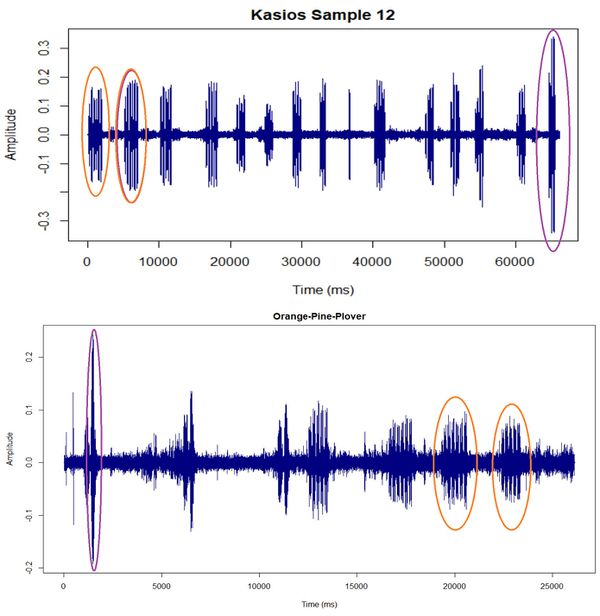
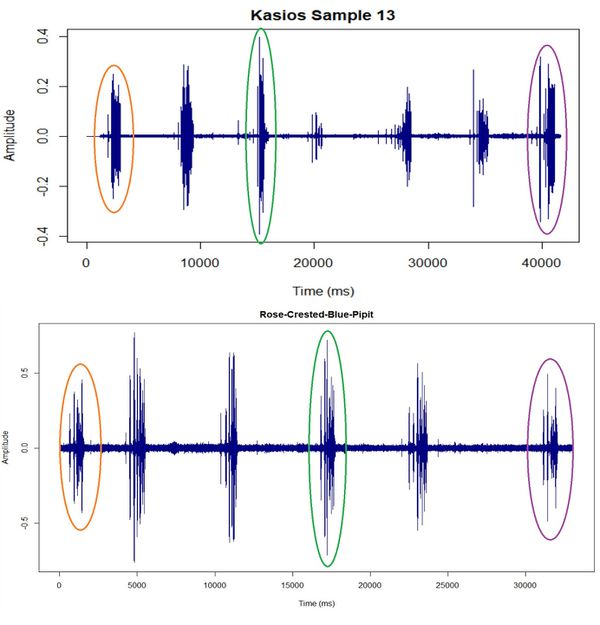
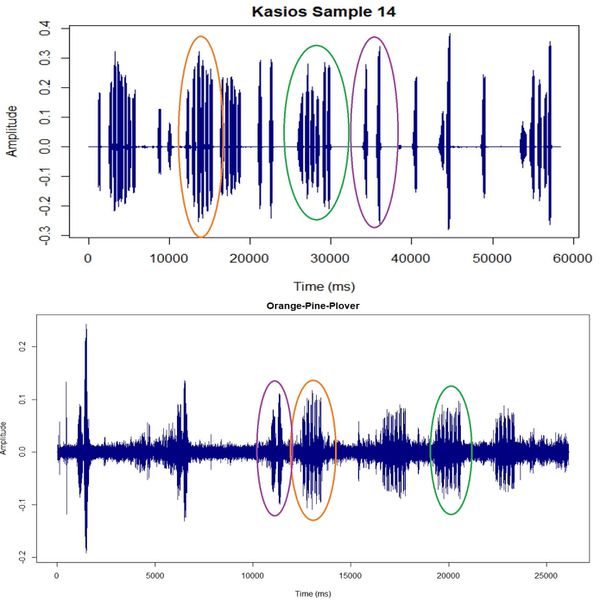
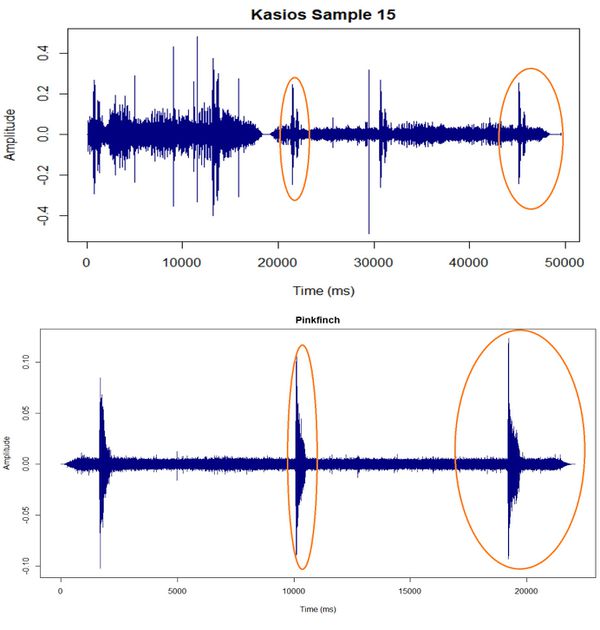
For the analysis, 15 Kasios audio plots are compared to the 19 bird species. Distinct patterns in the audio plots will help us identify which bird species it belongs to. The two plots are placed one on top of the other. The common patterns have been circled. Each colour oval represents the similar pattern i.e. if there are two colours, each colour represents a particular pattern. By identifying these significant and distinct visual patterns, we can map each audio file to the respective bird song pattern.
Comparison Sample 1
Comparison Sample 2
Comparison Sample 3
Comparison Sample 4
Comparison Sample 5
Comparison Sample 6
Comparison Sample 7
Comparison Sample 8
Comparison Sample 9
Comparison Sample 10
Comparison Sample 11
Comparison Sample 12
Comparison Sample 13
Comparison Sample 14
Comparison Sample 15
Summary
A summary and map plot of the results are shown below:
Based on the above results, the claims made by Kasios regarding Rose-crested Blue Pipits being found all across the Preserve is FALSE

