Difference between revisions of "Group21 Proposal"
| (24 intermediate revisions by the same user not shown) | |||
| Line 1: | Line 1: | ||
<div> | <div> | ||
| − | [[Image:Hello1.jpg|left| | + | [[Image:Hello1.jpg|left|500px]] |
| − | <font size = | + | <font size = 12; font color="#95081e"><span style="font-family:Comic Sans MS;"> MOVE TO</span></font> |
| − | MOVES YOU!</font> | + | <br><font size = 12; font color="#95081e"><span style="font-family:Comic Sans MS;"> WHAT</span></font> |
| + | <br><font size = 12; font color="#95081e"><span style="font-family:Comic Sans MS;"> MOVES YOU!</span></font> | ||
</div> | </div> | ||
| − | |||
<br> | <br> | ||
<br> | <br> | ||
Latest revision as of 14:22, 14 August 2018
|
|
|
|
|
|
Contents
Project Overview
The Housing & Development Board (HDB) Market has faced high volatility in Singapore over the years. This dynamic and ever-changing market has observed drastic price fluctuations from 1990 to 2018. While looking at the resale price trends in Singapore, it is observed that the market has seen a slightly upward bias in resale prices for 2018. Through the scope of this project, we intend to understand the current market trend of HDB Flats.
With a fluctuation in prices of HDBs in the markets, the purchase decision for HDBs becomes a major commitment for any prospective buyer. Hence, it becomes very important to understand the resale price trends of HDBs across different locations in Singapore. This would enable the users of our application to gain insights and understand the market overview of HDB flats.
Through the scope of this project, we intend provide the real estate agents, brokers, investors and other enthusiasts with interactive visualizations to understand market trends and facilitate investment decision.
Motivation
Based on our research, we observed that the existing visual representations on resale price trends fail to provide comprehensive insights to the users. Looking at the existing visualizations, we realized the need for an interactive visual dashboard that would provide the users of the application with a holistic view of the HDB Resale Price trends. We intend to address the pressing issue stated above by employing data visualizations techniques to provide a visual summary of the resale price trends in Singapore for the most recent data, a 12-month period (from June 2017 to May 2018).
Our desire to work on this project is encouraged by the interesting price trends of HDB flats in the market and data from Singapore Government website (https://data.gov.sg), where data is made readily available to the public for in-depth analysis.
The software R is used as the code base. R enables us to deploy powerful visualizations and easily prepare the data. This allows us to design complex visualizations easily and gain insights. The functions are available in different packages and are used to develop the application.
Review and Critic of Past Works
|
Visualization and Source |
Critique |
|
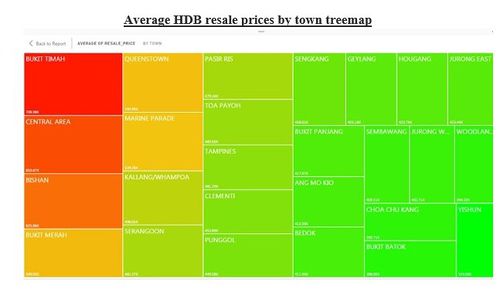
Treemap of Average HDB Resale Prices (SG Young Investment Blog) |
|
|
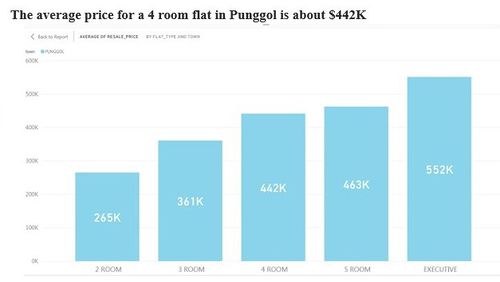
Bar Chart showing average resale price for a Room Type in a town
|
|
|
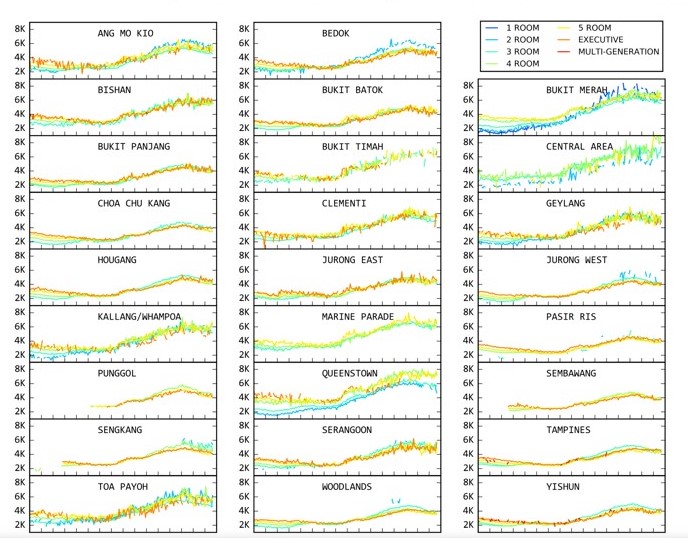
HDB Resale Prices for different flat types
|
|
About the Dataset
The data was taken from https://data.gov.sg. The data from June 2017 to May 2018 was taken for analysis as it represents the current market trend of HDB Flats. The data for the 12 months period contained Month, Town, Flat type, block and street name, Storey range, flat model, floor area, Lease commence date and remaining lease and Resale Prices
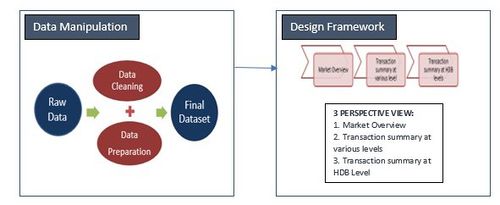
Analytical Framework
Expected Challenges
1. Extracting the latitude and longitude coordinates of each block without using the Postal district.
2. Data manipulation (summarizing, aggregating, grouping and creating subsets of the data) based on the visualization.
3. Building an interactive leaflet plot.


