Difference between revisions of "Group01 Dataset Overview"
| Line 69: | Line 69: | ||
We use Tableau Prep to run an overview of the data before any analysis. | We use Tableau Prep to run an overview of the data before any analysis. | ||
| + | |||
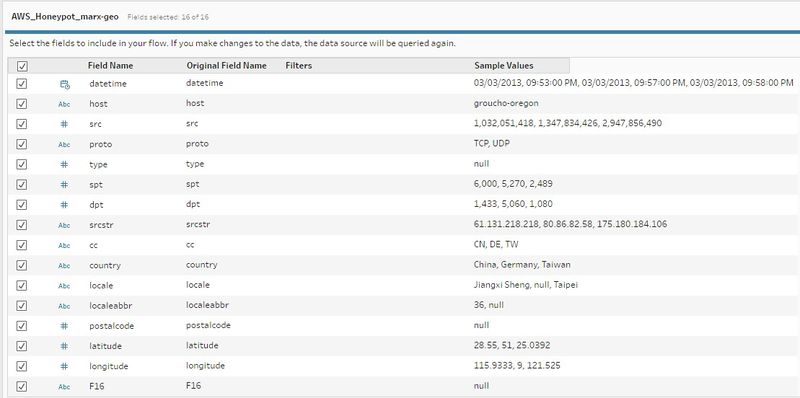
| + | <p>[[File:AWS Honeypont Dataset Overview.jpg|800px |left]]</p><br /> | ||
| + | <br /> | ||
| + | <br /> | ||
| + | <br /> | ||
| + | <br /> | ||
| + | <br /> | ||
| + | <br /> | ||
| + | <br /> | ||
| + | <br /> | ||
| + | <br /> | ||
| + | <br /> | ||
| + | <br /> | ||
| + | <br /> | ||
| + | <br /> | ||
| + | <br /> | ||
| + | <br /> | ||
| + | <br /> | ||
Revision as of 22:20, 22 July 2018
LINK TO PROJECT GROUPS:
Please Click Here -> [1]
|
|
|
|
|
|
|
|
|
|
Contents
What is Honeypot?
In simple terms, Honeypot is a trap for network attacks, and it records the IP addresses of such attacks.
As described by Amazon Web Service (AWS)[2], a honey pot is a security mechanism intended to lure and deflect an attempted attack. AWS’s honey pot is a trap point that one can insert into website to detect inbound requests from content scrapers and bad bots. The IP addresses are recorded if a source accesses the honeypot.
Overview of the AWS Honeypot Cyberattack
The test dataset of AWS Honeypot Cyberattack is retrieved from Kaggle,https://www.kaggle.com/casimian2000/aws-honeypot-attack-data/data
We use Tableau Prep to run an overview of the data before any analysis.
Analysis of Data fields
The interpretation of the data sets have been assisted with below reference. https://emreovunc.com/projects/honeypots_data_analysis.pdf https://www.kaggle.com/jonathanbouchet/aws-honeypot/notebook
What to analysis?
Without a doubt, the dataset requires data cleaning as the work proceeds. However, based on the analysis of the field, it is clear that
- The targets/destinations are 8 different servers (host)
- The attackers are from various sources around the world
- IP addresses
- Counties + cities
- Postcode + Geographic data
- Time log is available
We can run a few analyses
- Basic statistics of the data
- Advance visualisation of the data
- Animation of attacks showing “Origin Vs Destination” over the time log
