Difference between revisions of "Answer1"
Jump to navigation
Jump to search
| Line 15: | Line 15: | ||
==Question 1== | ==Question 1== | ||
| + | [[image:ppp1.jpg]] | ||
===Characterize the past and most recent situation with respect to chemical contamination in the Boonsong Lekagul waterways.=== | ===Characterize the past and most recent situation with respect to chemical contamination in the Boonsong Lekagul waterways.=== | ||
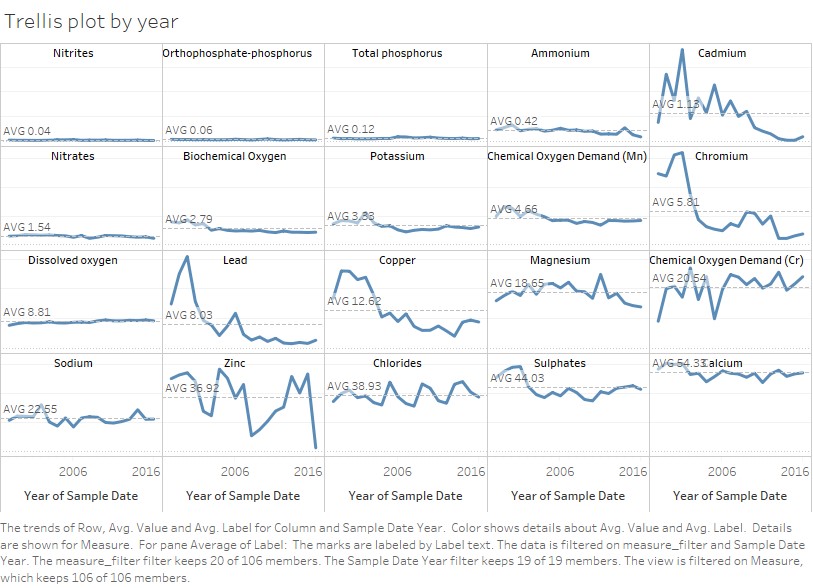
| + | From the trellis plot by year, Cadmium, Chromium, Lead, Copper, Zinc and Chemical Oxygen Demand (Cr) show relative more fluctuation during 1999-2016 and the rest of the chemicals keep more even at the same time. | ||
===Do you see any trends of possible interest in this investigation?=== | ===Do you see any trends of possible interest in this investigation?=== | ||
| + | |||
| + | [[image:ppp4.jpg]] | ||
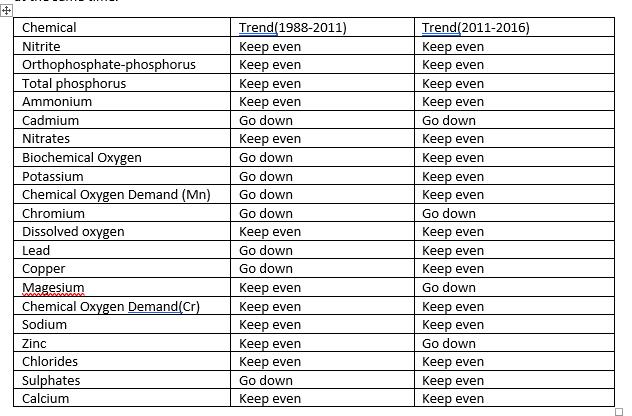
| + | According to above table, the Cadmium, Chromium, Lead, Copper, Magnesium, Zinc have more change on the trend. | ||
| + | ==Question 2== | ||
| + | [[image:ppp2.jpg]] | ||
| + | [[image:ppp3.jpg]] | ||
| + | ===What anomalies do you find in the waterway samples dataset?=== | ||
| + | ===How do these affect your analysis of potential problems to the environment?=== | ||
| + | ===Is the Hydrology Department collecting sufficient data to understand the comprehensive situation across the Preserve? === | ||
| + | ===What changes would you propose to make in the sampling approach to best understand the situation?=== | ||
| + | ==Question 3== | ||
| + | ===After reviewing the data, do any of your findings cause particular concern for the Pipit or other wildlife?=== | ||
| + | === Would you suggest any changes in the sampling strategy to better understand the waterways situation in the Preserve?=== | ||
Revision as of 09:53, 14 July 2018
Vast Chanllenge 2018 MC2
Like a duck to water
| Data Preparation | Visualization Design | Answer | Application | Assignments | |
Contents
- 1 Question 1
- 2 Question 2
- 2.1 What anomalies do you find in the waterway samples dataset?
- 2.2 How do these affect your analysis of potential problems to the environment?
- 2.3 Is the Hydrology Department collecting sufficient data to understand the comprehensive situation across the Preserve?
- 2.4 What changes would you propose to make in the sampling approach to best understand the situation?
- 3 Question 3
Question 1
Characterize the past and most recent situation with respect to chemical contamination in the Boonsong Lekagul waterways.
From the trellis plot by year, Cadmium, Chromium, Lead, Copper, Zinc and Chemical Oxygen Demand (Cr) show relative more fluctuation during 1999-2016 and the rest of the chemicals keep more even at the same time.
Do you see any trends of possible interest in this investigation?
 According to above table, the Cadmium, Chromium, Lead, Copper, Magnesium, Zinc have more change on the trend.


