Difference between revisions of "ISSS608 2017-18 T3 Assign Manu George Mathew Q3"
| (2 intermediate revisions by the same user not shown) | |||
| Line 54: | Line 54: | ||
<td> | <td> | ||
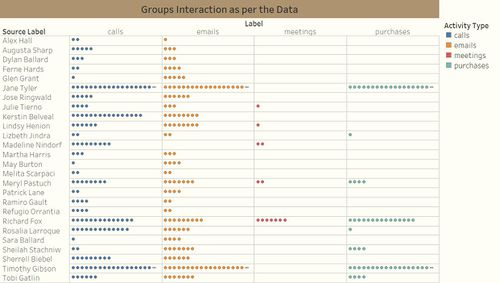
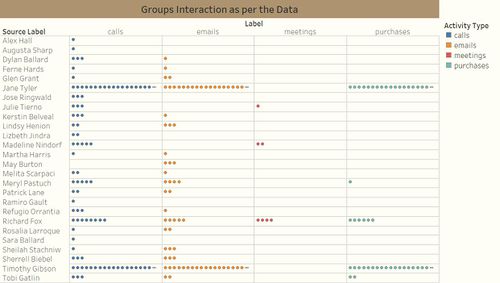
<b> 1.Characterize the group’s organizational structure and show a full picture of communications within the group </b> | <b> 1.Characterize the group’s organizational structure and show a full picture of communications within the group </b> | ||
| − | <br> | + | <br>We can observe that, |
| + | <ul> | ||
| + | <li>Madeline Nindorf has never interacted trough email.</li> | ||
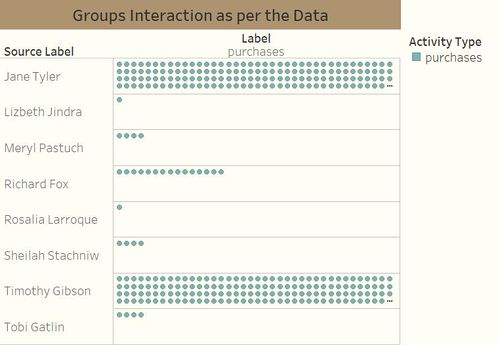
| + | <li>Only 8 people have initiated purchases in the group.</li> | ||
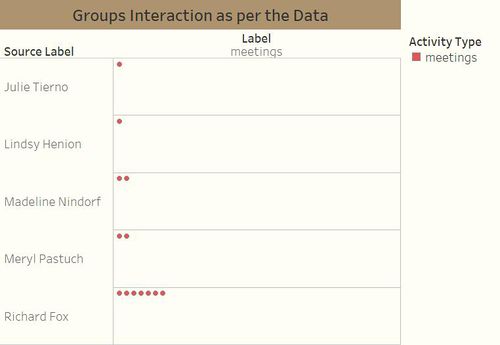
| + | <li>Only 5 people have taken part in meetings.</li> | ||
| + | </ul> | ||
</td> | </td> | ||
<td> | <td> | ||
| − | < | + | <br> All communications within the group. Each point shows an instance of communication. |
| − | [[File:mgm_Q3_1.jpeg|500px|center]] | + | [[File:mgm_Q3_1.0.jpeg|500px|center]] |
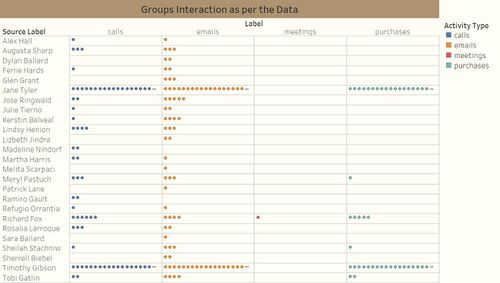
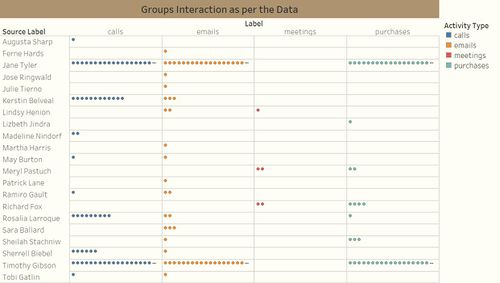
| + | <br> Taking a drill down view onto the meetings and Purchases, | ||
| + | [[File:mgm_Q2_3.2.jpg|500px|center]] | ||
| + | [[File:mgm_Q3_1.1.jpg|500px|center]] | ||
</td> | </td> | ||
</tr> | </tr> | ||
| Line 64: | Line 72: | ||
<tr> | <tr> | ||
<td> | <td> | ||
| − | <b> 2.Does the group composition change during the course of their activities? </b> | + | <b> 2.Does the group composition change during the course of their activities?</b> |
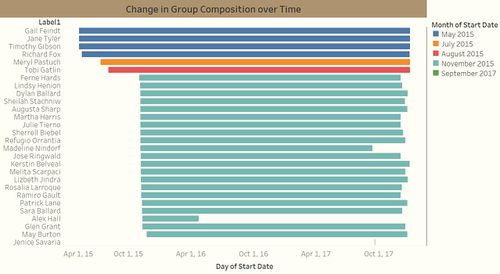
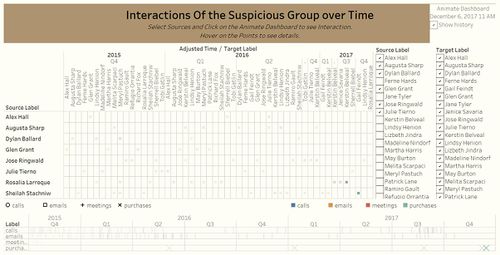
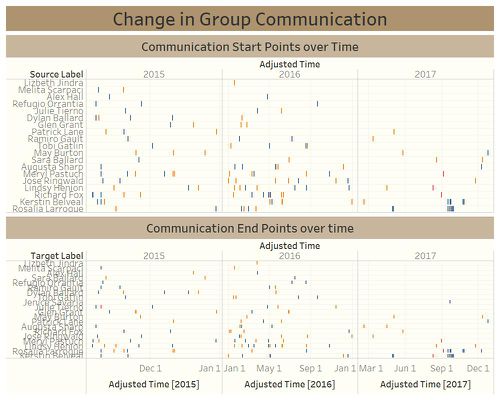
<br> Using the following visualization, we can observe that 2 of the members in the group moved away from in the course of their activities. They are Alex Hall in 2016 and Madeline Nindorf in 2017. | <br> Using the following visualization, we can observe that 2 of the members in the group moved away from in the course of their activities. They are Alex Hall in 2016 and Madeline Nindorf in 2017. | ||
<br> But this again does not talk about whether they were part of the group's activities during this period. the second set of visualizations, aims to solve this predicament. | <br> But this again does not talk about whether they were part of the group's activities during this period. the second set of visualizations, aims to solve this predicament. | ||
| Line 84: | Line 92: | ||
Looking at the interactions year wise, | Looking at the interactions year wise, | ||
<br> In 2015: | <br> In 2015: | ||
| − | [[File:mgm_Q3_2.1.jpeg| | + | [[File:mgm_Q3_2.1.jpeg|500px|center]] |
<br> In 2016: | <br> In 2016: | ||
| − | [[File:mgm_Q3_2.2.jpeg| | + | [[File:mgm_Q3_2.2.jpeg|500px|center]] |
<br> In 2017: | <br> In 2017: | ||
| − | [[File:mgm_Q3_2.3.jpeg| | + | [[File:mgm_Q3_2.3.jpeg|500px|center]] |
</td> | </td> | ||
| Line 112: | Line 120: | ||
<p> | <p> | ||
View the interactive Tableau design here: | View the interactive Tableau design here: | ||
| − | [https://public.tableau.com/profile/manugeorge.mathew#!/vizhome/VastChallenge2018-MC3-InteractionsBetweenSuspiciousParty/InteractionsoftheGroupoverTime?publish=yes Link to tableau dashboard] | + | |
| + | <br>[https://public.tableau.com/profile/manugeorge.mathew#!/vizhome/VastChallenge2018-MC3-SuspiciousGroupinteractionsatKasios/YearWiseInteractionCounts?publish=yes Link to tableau dashboard in Sub Question 1 and 2] | ||
| + | <br>[https://public.tableau.com/profile/manugeorge.mathew#!/vizhome/VastChallenge2018-MC3-InteractionsBetweenSuspiciousParty/InteractionsoftheGroupoverTime?publish=yes Link to tableau dashboard in Sub Question 2 and 3] | ||
</p> | </p> | ||
| Line 120: | Line 130: | ||
</p> | </p> | ||
<ul> | <ul> | ||
| − | |||
<li>The group is comprised of people who joined in November of 2015 if we exclude Richard Fox, Jane Tyler, Gail Feindt and Timothy Gibson.</li> | <li>The group is comprised of people who joined in November of 2015 if we exclude Richard Fox, Jane Tyler, Gail Feindt and Timothy Gibson.</li> | ||
<li>The only interaction Jenise Savaria had with the group was in 2017 when Rosalia Larroque placed the purchase order with her.</li> | <li>The only interaction Jenise Savaria had with the group was in 2017 when Rosalia Larroque placed the purchase order with her.</li> | ||
| Line 127: | Line 136: | ||
<li>We aslo see that Alex Hall left the company in 2016 and Madeline Nindroff left them in 2017.</li> | <li>We aslo see that Alex Hall left the company in 2016 and Madeline Nindroff left them in 2017.</li> | ||
<li>By observing the Target Label axis of the Dashboard, we can see that, over the years, the number of people being contacted is showing a decline.</li> | <li>By observing the Target Label axis of the Dashboard, we can see that, over the years, the number of people being contacted is showing a decline.</li> | ||
| − | + | <li>Checking the over time transaction patterns, it is highly possible that Jane Tyler and Timothy Gibson are not part of the group's operations. Thus the criterion for suspicious people could be changed to more than 8 interactions with the group.</li> | |
</ul> | </ul> | ||
Latest revision as of 17:33, 11 July 2018
|
|
|
|
|
|
|
|
Question:
Using the combined group of suspected bad actors you created in question 2, show the interactions within the group over time.
Visualization and Analysis
| Description | Illustration |
|---|---|
|
1.Characterize the group’s organizational structure and show a full picture of communications within the group
|
|
|
2.Does the group composition change during the course of their activities?
|
Looking at the interactions year wise,
|
|
3.How do the group’s interactions change over time?
|
The communication Trend is visualized as shown. |
Links and Guide to Dashboard
View the interactive Tableau design here:
Link to tableau dashboard in Sub Question 1 and 2
Link to tableau dashboard in Sub Question 2 and 3
Insights
By using the above Plots, we can infer that,
- The group is comprised of people who joined in November of 2015 if we exclude Richard Fox, Jane Tyler, Gail Feindt and Timothy Gibson.
- The only interaction Jenise Savaria had with the group was in 2017 when Rosalia Larroque placed the purchase order with her.
- The above purchase was unusual as all the past purchases have been handled by Gail Feindt. This brings a possibility that Gail Feindt has backed out of the group's activities.
- Jane Tyler, Gail Feindt and Timothy Gibson have been in the organization the longest over time.
- We aslo see that Alex Hall left the company in 2016 and Madeline Nindroff left them in 2017.
- By observing the Target Label axis of the Dashboard, we can see that, over the years, the number of people being contacted is showing a decline.
- Checking the over time transaction patterns, it is highly possible that Jane Tyler and Timothy Gibson are not part of the group's operations. Thus the criterion for suspicious people could be changed to more than 8 interactions with the group.

