ISSS608 2017-18 T3 Assign Liu Yuanjing Conclusion
Conclusion & Recommendations
Top 4 conclusion
1) Fig 5.1 right graph reveals the two adjacent detection points.We choose Kohsoom and Busarakhan as pair comparative analysis targets.From the map, the two sampling sites are closest to each other.Therefore, we can utilize these two position to determine the area environment and find pollution point.Two adjacent detection points have relative small distances but the chemical measure are different but in the same location, there are still some measures has similar motion tracks.
2) the Macrozoobenthos could help us understand the location pollution and represent a inversely relationship with almost measures.
3) The Decha and Tansanee have the record from 2009 and anomalies are relative less than other area. Most complicated areas is water paths 5,6,7 and in this area, most of the sources of pollution may be concentrated upstream because the pollutants and upstream components of the downstream rivers are the same and the content is low.
4) In recent years, the overall water environment quality has become better.
Recommendations
1)Provide more local hydrological information, such as river width, depth, vegetation coverage, etc., only the water content can not confirm the pollution range by 100%.
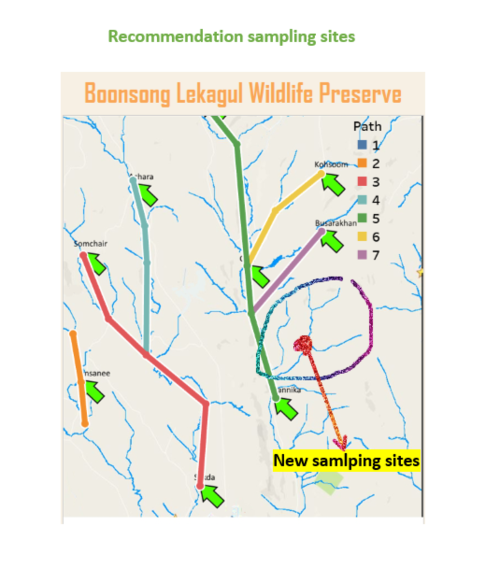
2)Add one sampling sites at below graph point, because this area has really complicated environment, where there are more tributaries of different sizes and a wider range. Existing sampling sites cannot cover this area.

