ISS608 2017-18 T3 G2 Assign ChenYanchong Data Prep
Contents
Data overview
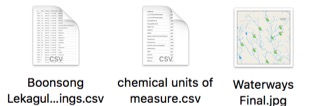
The following lists the data used for the analysis. The data is obtained from VAST Challenge 2018: Mini-Challenge 2.

Data description
Tools
R, Excel, Tableau
Data understanding
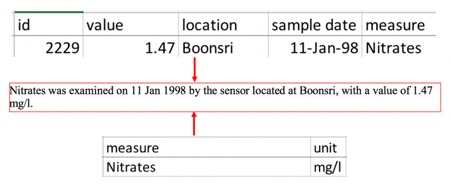
Integrated the two tables together, a record can be read as below format:

On the same day, a chemical could be examined multiple times, at most three times per day (as founded). One possible reason is that the sensor was triggered three times one day (since the ids are different) but at different date time, since timestamp information is not provided, this assumption can not be verified. However, to be fair, the when grouping data, the mean value is taken instead of the summation of the values.

Data preparation
Step 1
1.1 Filtered data from year 2010 to year 2016 with below reasons:
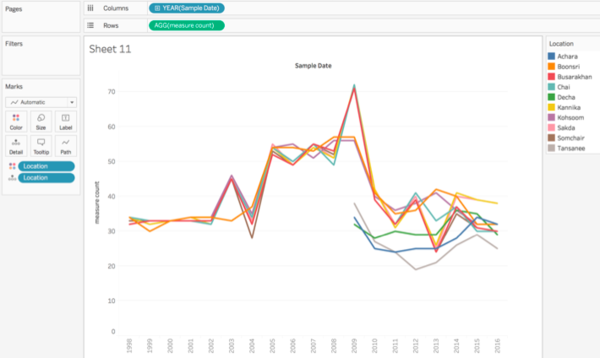
1.2 In tableau, created a new calculated field, named "measure count" with formula "COUNTD([Measures])"
 this value of this field reveals the number of measures appear in each year
1.3 Drag the calculated field (measure count) on rows shelf, sample date on column shelf and location on color card as well as on detail card

From graph above, noted that the sensors in Achara, Decha and Tansanee started to work on year 2009.
One year 2009, all the locations have abnormal high starting point, in other words, the number of chemical types in each location are higher than normal value. To investigate further, such anomaly could be caused by storm water [1]or urban flooding.[2]
Step 2
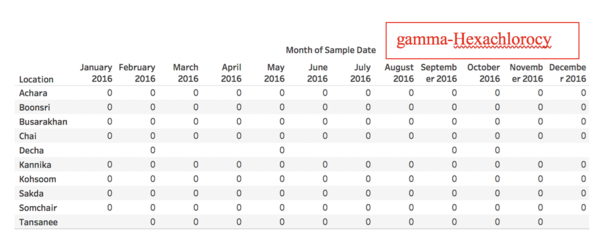
A large amount of zero values were found in the collected data, one assumption of such zeros is that the corresponding chemicals was measured at that specific sensing, whilst none of that chemical was found. Hence, zeros should be removed.
One example:
Put location on rows shelf and sample date on column, expanded sample date to month, drag value on label card, drag year on filter and choose value 2016, drag measure on filter and choose value gamma-Hexachlorocy.

Step 3: Using R to prepare the data
3.1 The comparison should be consistent among the 10 locations, hence, data from 1998 to 2008 are filtered out.
3.2 Anomaly pattern which cause a sudden increase simultaneously across the 10 locations should be ignore, hence, year 2009 is filtered out.
3.3 Zeros are meaningless in the data set, should be removed.
related R script will be uploaded to LMS
With the prepared data, fair comparisons can be performed across the preserve.
