Answers
|
|
|
|
|
Q1. Is there any trend or anomaly?
Before diving into the visualizations, let's clarify the proof process and interference factors.
1. Check the population of Rose-Crested Blue Pipits. Is their population declining over years? -- what happened to blue pipits?
2. If yes, is that happening to other species? -- exclude interference by setting control groups
3. Where do pipits and other birds live? Have they changed their habitat? -- Geographical exporation
4. Is the reason of population decline the dumping site or is it something else? -- explore possible reasons of population decline
Starting from the first question raised before (whether the population of rose pipits is declining), we can derive the conclusion from Viz.1 that the Blue pipit's population is declining in fact.
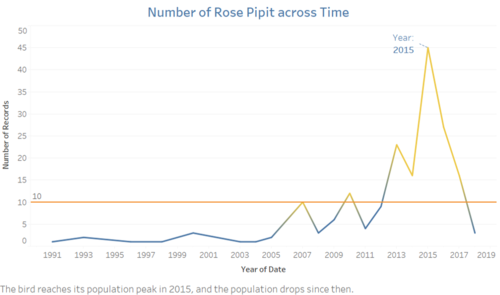
From the graph,it's clear that the bird reaches its population peak in 2015, and the population drops since then.
Now, what about other species' population?
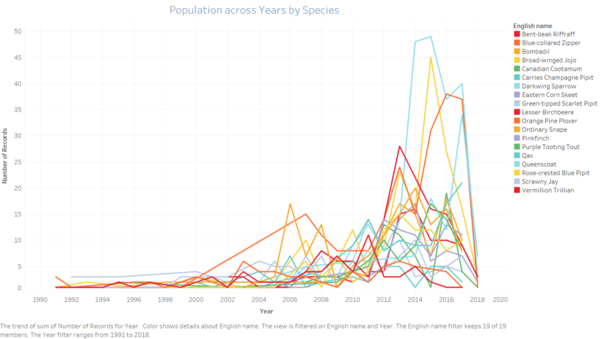
As shown by Viz.2, most of other species also have population decline since 2015 and 2016, some since 2014. For specific info please check the published story.
Geographical Visualization for all birds, Rose-crested blue pipits, Green-tipped Scarlet Pipit, and Eastern Corn Skeet. The last two species are two most active species besides Rose pipits.
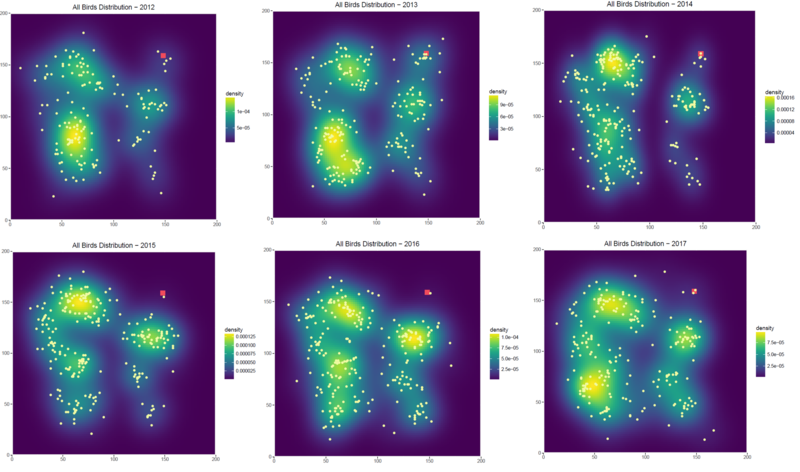
From All birds distribution, there used to be birds active around the dumping site in 2012-2014, the peak is in 2013. However, since 2015, birds become very scarce around the site. Another point is that the density dropped from e-4 to e-5 in 2017, which resonates with Viz.2.
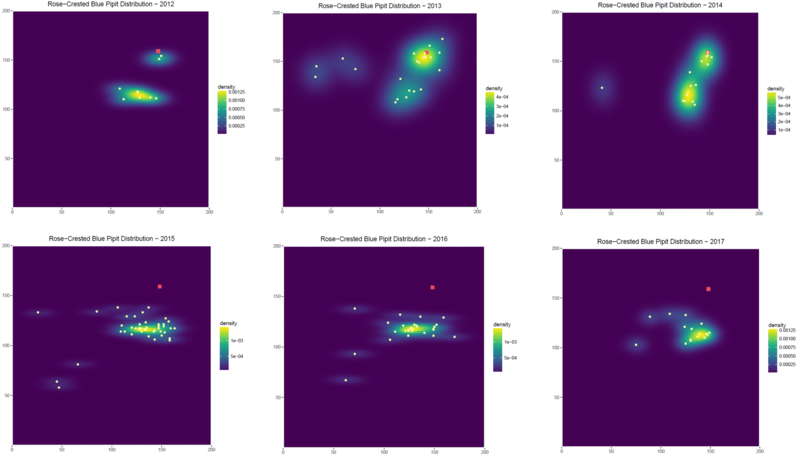
The movement of rose pipit is even more obvious than the all birds distribution. In 2012-2014, there were many rose pipits active around the site. There are two clusters of them, one around the dumping site, and another cluster below that. But from 2015, there is only one cluster, the cluster around dumping site disappeared.
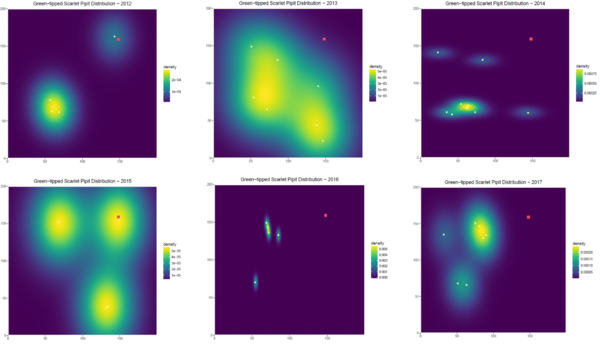 ....... .......
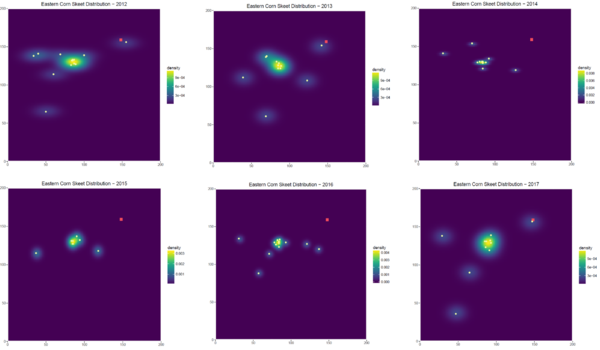
Green pipits(left) and Eastern Corn Skeet(right) also shows some signs of getting away from the site in 2016 and 2017, but since the population is small and changes are not very obvious, here we cannot make the conclusion that the dumping site is affecting all birds.
Q2. Are the sounds that Kasio company provided really Rose-crested Blue Pipits?
Using librosa package from python, I generated visualized audio waves for the 15 audios given by Kasios company(test file) and the audio package provided by the university(sample file).
The university bird audio package has 2081 files. Since birds have different sounds for call and song, randomly select one call audio and one song audio for each species. All sample file selected are of A or at least B quality, to avoid noise interference and make sure of the waveplot accuracy.
Since all the test audios has range in -0.4~0.4, and so is blue pipits sample audio(both call and song), I set the sample file to the same range. In this way, it automatically excludes many audios when matching them against the test audios.
