ISSS608 2017-18 T1 Assign MA XIAOLIU Epidemic exploration
|
|
|
|
|
|
When and where
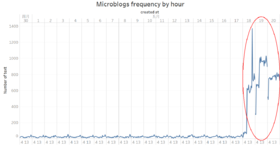
Firstly, I check the frequency of microblogs by hour, it is obvious that from 18 May, there is a large increase in the number of text. On May 18 to 20, the number of text are always very high. This time of period might be the epidemic outbreak time.
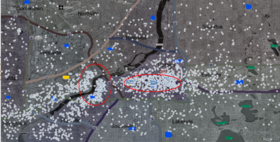
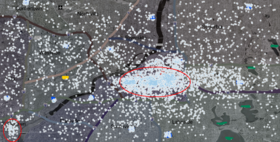
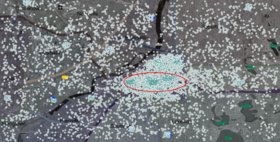
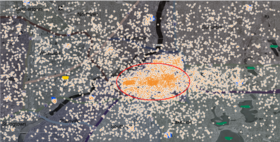
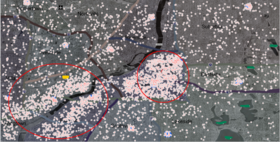
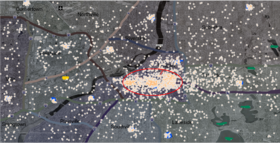
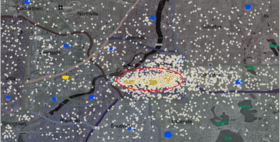
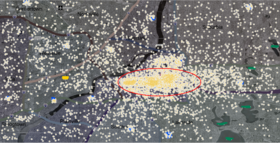
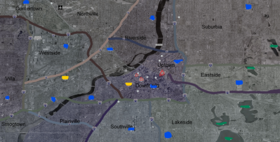
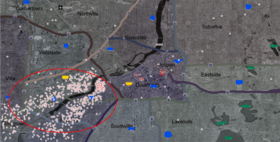
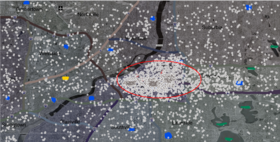
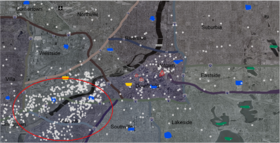
Check the distribution of the people who send the text which related to the epidemic, it can be found that on the first which is May 18, the number of people are increased rapidly and gather in the downtown area. On May 19, except downtown, the river downstream which below the 610 highway appears a lot of people who might get ill. On May 20, the distribution don’t change much, only the number of people seems been declined. Besides many people gather in the hospital.
The symptoms’ distribution
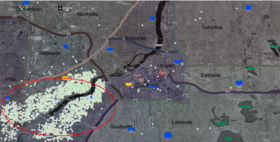
Check the distribution of the symptoms, there is an interesting finding. The symptom include diarrhea,nausea, and vomit gather near the river which in the smogtown,, westsile and plainsille. The symptom include breath difficulty, chill, cough, fever and flu are spread widely. Besides, they are main focus in the downtown and the neighborhood, like uptown and eastville.
According to the symptom distribution, it can be found that not every symptom that distribute in the whole city. Most of them are only focus in 1 or 2 areas. Besides, some symptoms have very similar gathering places and are belong to the same cause. So this epidemic might mixed with different illness but outbreak in the same time period.
| Symptom | Location | Illness Category |
|---|---|---|
| Ache, Sweat, Fever, breath, Flu, Chill, Pain, Fatigue, Cough | focus in the downtown area, near the capital buildings, also some in the smogtown | Flulike illness which is related to Respiratory |
| Vomit, Nausea, Diarrhea, Pain | Below the 610 highway, near the river downstream | Intestines and stomach disease |

