Difference between revisions of "ISSS608 2017-18 T1 Assign MA XIAOLIU Origin and Epidemic Spread"
(Created page with "<div style=background:#2B3820 border:#A3BFB1> 280px <font size = 5; color="#FFFFFF"> Epidemic Spread in Smartpoils</font> </div>") |
|||
| (8 intermediate revisions by the same user not shown) | |||
| Line 1: | Line 1: | ||
<div style=background:#2B3820 border:#A3BFB1> | <div style=background:#2B3820 border:#A3BFB1> | ||
| − | [[file:Timg.jpg| | + | [[file:Timg.jpg|260px]] |
| − | <font size = | + | <font size = 6; color="#FFFFFF"> Epidemic Spread in Smartpoils</font> |
</div> | </div> | ||
| + | <!--MAIN HEADER --> | ||
| + | {|style="background-color:#1B338F;" width="100%" cellspacing="0" cellpadding="0" valign="top" border="0" | | ||
| + | | style="font-family:Century Gothic; font-size:100%; solid #000000; background:#2B3820; text-align:center;" width="16.67%" | | ||
| + | ; | ||
| + | [[ISSS608_2017-18_T1_Assign_MA XIAOLIU_Overview| <font color="#FFFFFF">Overview</font>]] | ||
| + | |||
| + | | style="font-family:Century Gothic; font-size:100%; solid #1B338F; background:#2B3820; text-align:center;" width="16.67%" | | ||
| + | ; | ||
| + | [[ISSS608_2017-18_T1_Assign_MA XIAOLIU_Data_Preparation| <font color="#FFFFFF">Data Preparation</font>]] | ||
| + | |||
| + | | style="font-family:Century Gothic; font-size:100%; solid #1B338F; background:#B0620E; text-align:center;" width="16.67%" | | ||
| + | ; | ||
| + | [[ISSS608_2017-18_T1_Assign_MA XIAOLIU_Origin and Epidemic Spread| <font color="#FFFFFF">Origin and Epidemic Spread</font>]] | ||
| + | |||
| + | | style="font-family:Century Gothic; font-size:100%; solid #1B338F; background:#2B3820; text-align:center;" width="16.67%" | | ||
| + | ; | ||
| + | [[ISSS608_2017-18_T1_Assign_MA XIAOLIU_transmition| <font color="#FFFFFF">transmition</font>]] | ||
| + | |||
| + | | style="font-family:Century Gothic; font-size:100%; solid #1B338F; background:#2B3820; text-align:center;" width="16.67%" | | ||
| + | ; | ||
| + | [[ISSS608_2017-18_T1_Assign_MA XIAOLIU_Suggestion| <font color="#FFFFFF">Suggestion</font>]] | ||
| + | |||
| + | | style="font-family:Century Gothic; font-size:100%; solid #1B338F; background:#2B3820; text-align:center;" width="16.67%" | | ||
| + | ; | ||
| + | [[ISSS608_2017-18_T3_Assign_MA XIAOLIU_Conclusion| <font color="#FFFFFF">Conclusion</font>]] | ||
| + | |||
| + | |} | ||
| + | <br/> | ||
| + | =Zero Location= | ||
| + | Firstly, I check the frequency of microblogs by hour, it is obvious that from 18 May, there is a large increase in the number of text. | ||
| + | [[file:microblogs_frequency_by_hour.jpg|450px]] | ||
| + | |||
| + | Zoom the day 18 to 20. On May 18, from 7:00am to 8:00am, there is a first sharp increase during this period.it can be estimate that the outbreak time is around at 7:00am to 8:am on May 18. Then we can check the time on the map, to see where is the syptom appears and the people gathering. | ||
| + | |||
| + | [[file:Microbolgs_frequency_by_hour2.png|450px]] | ||
| + | |||
| + | Compare the number of ID and their location at 7:00am and 8:00am. It is obvious that the number of people are increased and they gather at downtown. So I think that downtown is the zero location. | ||
| + | |||
| + | [[file:ID_location.jpg|450px]] | ||
| + | |||
| + | Check the symptom distribution. The symptoms also appear in the downtown. | ||
| + | |||
| + | [[file:symptom_distribution.png|450px]] | ||
| + | |||
| + | =Affected Area= | ||
| + | On May 19, the first outbreak of the number of text happens at 1:00 am to 2:00 am. The second outbreak happens at 7:00am. There is a very interesting things is that the outbreak time is at the time that many people are in a dream and the time in the morning rush. According to this phenomenon, it can be speculated that the disease has spread and affected other areas. | ||
| + | |||
| + | [[file:19day.png|450px]] | ||
| + | |||
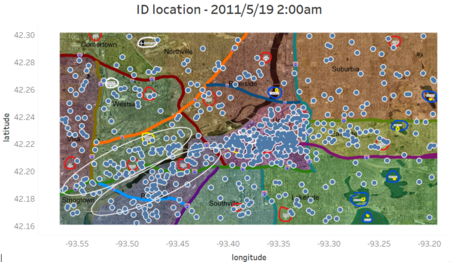
| + | Check the map at 2:00am May 19, then we can find that the people which has get the disease or related to the ful is spread to other places. Except the downtown, the people are gathering near the river, which is circled in the map. These areas are affected. | ||
| + | |||
| + | [[file:19_2am.png|450px]] | ||
Latest revision as of 23:19, 15 October 2017
|
|
|
|
|
|
|
Zero Location
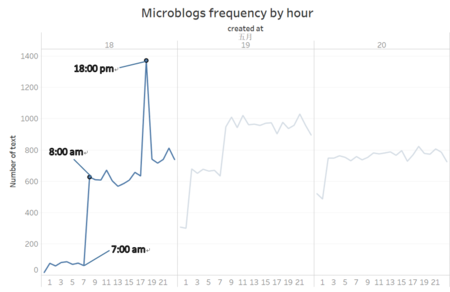
Firstly, I check the frequency of microblogs by hour, it is obvious that from 18 May, there is a large increase in the number of text.
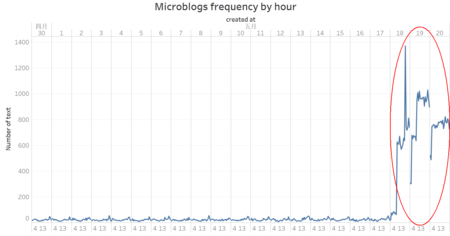
Zoom the day 18 to 20. On May 18, from 7:00am to 8:00am, there is a first sharp increase during this period.it can be estimate that the outbreak time is around at 7:00am to 8:am on May 18. Then we can check the time on the map, to see where is the syptom appears and the people gathering.
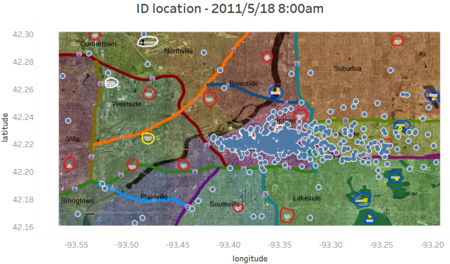
Compare the number of ID and their location at 7:00am and 8:00am. It is obvious that the number of people are increased and they gather at downtown. So I think that downtown is the zero location.
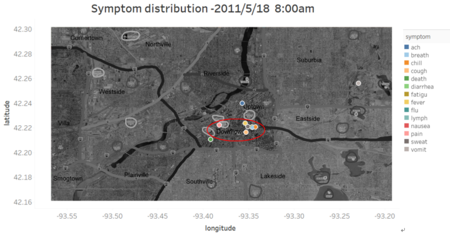
Check the symptom distribution. The symptoms also appear in the downtown.
Affected Area
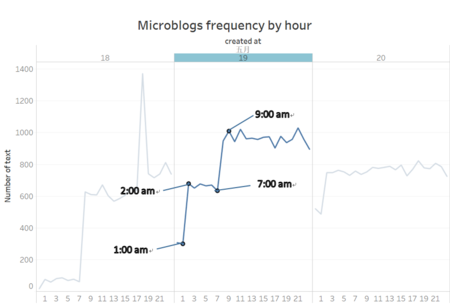
On May 19, the first outbreak of the number of text happens at 1:00 am to 2:00 am. The second outbreak happens at 7:00am. There is a very interesting things is that the outbreak time is at the time that many people are in a dream and the time in the morning rush. According to this phenomenon, it can be speculated that the disease has spread and affected other areas.
Check the map at 2:00am May 19, then we can find that the people which has get the disease or related to the ful is spread to other places. Except the downtown, the people are gathering near the river, which is circled in the map. These areas are affected.

