Difference between revisions of "ISSS608 2017-18 T1 Assign NURUL ASYIKEEN BINTE AZHAR Transmission"
Jump to navigation
Jump to search
| Line 27: | Line 27: | ||
|} | |} | ||
<br/> | <br/> | ||
| − | == What were the Affected Areas == | + | == What were the Most Affected Areas == |
| − | Examining the main affected areas would provide clues on the transmission mode of the epidemic. Figure 1 shows that Downtown, Plainville and Westside have the most number of sick related messages. Thus, the transmission mode(s) | + | Examining the main affected areas would provide clues on the transmission mode of the epidemic. Figure 1 shows that Downtown, Plainville and Westside have the most number of sick related messages for 18 May 2011 and 19 May 2011 with Downtown dominating the top spot with 6,169 and 7,013 sick messages on those days respectively. Thus, the transmission mode(s) should be in such a manner that can affect these city zones the quickest. |
| + | <br/> | ||
| + | [[File:Sickness Location Day.png|600px|center]] | ||
| + | <br/> | ||
| + | <div class="center" style="width:auto; margin-left:auto; margin-right:auto;">'''Figure 1'''</div> | ||
| + | |||
| + | === Downtown === | ||
Revision as of 22:03, 15 October 2017
Investigation of Smartpolis Epidemic Outbreak
|
|
|
|
|
|
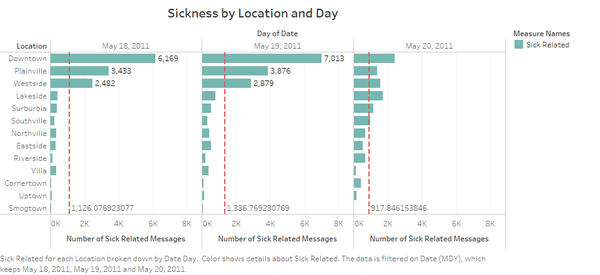
What were the Most Affected Areas
Examining the main affected areas would provide clues on the transmission mode of the epidemic. Figure 1 shows that Downtown, Plainville and Westside have the most number of sick related messages for 18 May 2011 and 19 May 2011 with Downtown dominating the top spot with 6,169 and 7,013 sick messages on those days respectively. Thus, the transmission mode(s) should be in such a manner that can affect these city zones the quickest.

Figure 1