Difference between revisions of "ISSS608 2017-18 T1 Assign NURUL ASYIKEEN BINTE AZHAR Ground Zero"
(Created page with "<div style=background:#3a9cad border:#A3BFB1> <font size = 5; color="#FFFFFF"> Investigation of Smartpolis Epidemic Outbreak</font> </div> <!--MAIN HEADER --> {|style="backg...") |
|||
| Line 26: | Line 26: | ||
| | | | ||
|} | |} | ||
| + | <br/> | ||
| + | == When did the Epidemic Start == | ||
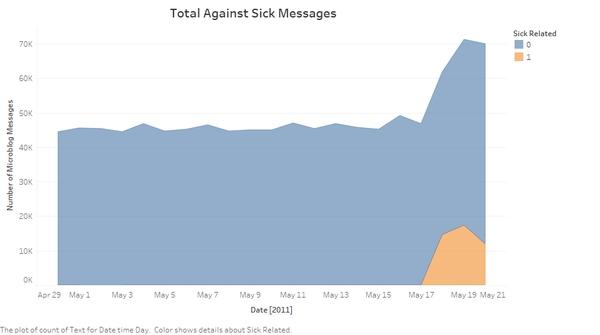
| + | The total number of messages was plotted across time, differentiating between sick (indicated as "1") and non-sick (indicated as "0") messages. Figure 1 shows a sharp spike in sick related messages from 18 May 2011 onwards. Since symptoms of the virus spreads take some time to manifest, we may conclude that an incident preceding to the start of the epidemic (i.e. 17 May 2011) and look for clues of where the disease may have started from. | ||
| + | |||
| + | [[File:TotalvsSick.png|600px|center]] | ||
| + | <br/> | ||
| + | |||
| + | == Where did the Epidemic Start == | ||
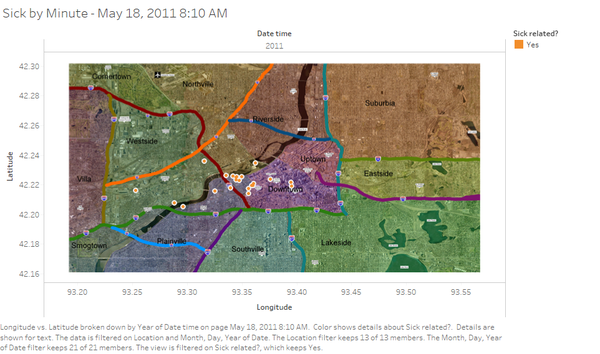
| + | IDs with sick messages are plotted on the map and played through the dates, particularly on 17 May 2011 and 18 May 2011. The number of sick messages on 17 May 2011 was consistently low as per the previous says. However, on the '''morning of 18 May 2011, at 8.10am''', a noticeable cluster of sick messages are observed near the bridge of expressway 610 as displayed in the figure below. | ||
| + | |||
| + | [[File:Sick_Min.png|600px|center]] | ||
<br/> | <br/> | ||
Revision as of 19:56, 15 October 2017
Investigation of Smartpolis Epidemic Outbreak
|
|
|
|
|
|
When did the Epidemic Start
The total number of messages was plotted across time, differentiating between sick (indicated as "1") and non-sick (indicated as "0") messages. Figure 1 shows a sharp spike in sick related messages from 18 May 2011 onwards. Since symptoms of the virus spreads take some time to manifest, we may conclude that an incident preceding to the start of the epidemic (i.e. 17 May 2011) and look for clues of where the disease may have started from.
Where did the Epidemic Start
IDs with sick messages are plotted on the map and played through the dates, particularly on 17 May 2011 and 18 May 2011. The number of sick messages on 17 May 2011 was consistently low as per the previous says. However, on the morning of 18 May 2011, at 8.10am, a noticeable cluster of sick messages are observed near the bridge of expressway 610 as displayed in the figure below.

