ISSS608 2017-18 T1 Assign RACHEL TONG OutbreakContainmentStatus
|
|
|
|
|
|
|
|
Part III - Containment |
This section of the notes is dedicated to evaluating the disease containment status.
Assessing Containment Status
Assessment Based on Time Trends
Observing Time Trends about General Messages
By considering the aggregated number of microblog messages over 15-minute intervals by type (flu-like symptom messages, gastrointestinal-related messages, and others) with time, it may be seen that the number of general messages (‘other’, in green) follows a periodic trend; with a spike observed at 9PM each night (baseline approx. 4,000 messages), followed by a dip 3 hours later at 12AM (baseline approx. 1,600 messages). This trend remained stable with a low of around 1,100 messages, and a high of around 4,000 messages from the 15th to 17th of May.
However, over the subsequent days from the 18th to the 20th of May, a loss of base was observed for these general type messages.
Observing Time Trends about Symptomatic Messages
As was observed similarly in the geospatial exploration, the jump in the number of messages about the flu-like symptoms (blue line) started on the 18th. The trend fluctuated at around 1,000 messages per 15 minutes from the 18th to the night of the 19th. It then underwent a stepwise decrease to around 600 messages per 15-minute interval from the morning of the 20th until the latest messages on the night of the 20th.
On the other hand, gastrointestinal-related messages (orange line) underwent an approximate stepwise increase to slightly less than 100 messages per 15-minutes at around midday on 19th May, followed by a similar stepwise increase a day layer at around midday on 20th May.
Time Trend Findings
From the observed decrease in mentions of flu-like symptoms, it may be inferred that the flu-like symptoms may be abating in general. In contrast, based on the trend in gastrointestinal-related symptom messages, it remains undeterminable whether or not said symptoms are abating or not; neither is it possible to tell based on inference from the trend in general messages, given the trend drift observed since the 18th.
Nevertheless, based on the relatively stable trend in both types of symptomatic messages, it may be deduced on a macroscopic level that both illnesses are likely to be contained.
Assessment Based on Geospatial Patterns
Flu-like Symptoms
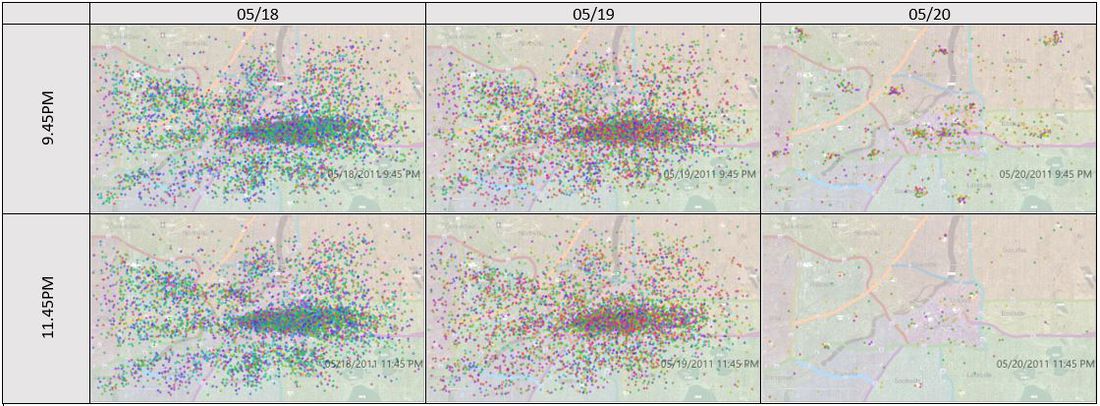
Considering that on the night of 20th May, we see the migration of symptomatic messages to regional hospitals, followed by the dispersion of the strong patterns observed since the nights of the 18th and 19th, it may be deduced that the flu-like symptoms have mostly been contained.
In Part II, we established that the gastrointestinal symptoms (nausea, diarrhea, and stomachache) were localised to southernmost Villa, and along the river banks of Plainville, Westside, and Smogtown. Since the gastrointestinal symptoms seem to be localised to the same places throughout the duration for which the concentrated patterns were observed, it may be inferred that this group of symptoms is contained.
Furthermore, as of the night of the 20th (right), the gastrointestinal symptom patterns along the affected regions appear to be significantly dispersed compared to the night before (left), indicating likely abatement of the cases of such symptoms at the affected areas. Unlike the earlier time trend plots (which served to reveal more macro-level trends), such a geospatial visualization thus affords a more granular view of the situation for the gastrointestinal-related symptoms, providing insight into some evidence suggesting that this illness is in fact likely to be in the midst of abatement.
Assessing the Need for Deploying Treatment Resources
On the whole, both illnesses appear to be generally contained and not in danger of further escalation. As such, this is unlikely to be an active epidemic, and treatment resources are not likely to be required for aggressive transmission control. Nevertheless, given the large volume of symptomatic messages observed, a similarly large volume of patients should be expected at the various regional hospitals. The case for additional treatment resources is further bolstered when considering the existence of the small clusters of symptomatic messages observed near hospitals (circled in blue) in the late evening of the 20th of May.
Under such circumstances, it would be prudent to deploy treatment resources to cater to the surge in patients at hospitals.
An additional aspect regarding the deployment of resources is that a resource allocation should be prioritized for hospitals in the worst-hit regions (demarcated in red, above). These include areas along the southern banks of the Vast River, and in central and eastern Smartpolis, effectively putting the following 7 hospitals up for consideration:
- Villa Hospital
- Westside Hospital
- Plainville Hospital
- Northside Hospital
- Vastopolis City Hospital
- St. Georges Hospital
- St. Kristin’s Hospital
|
|
|
|
|
|
|

