ISSS608 2017-18 T1 Assign DENG YUETONG Data Preparation
|
|
|
|
Data Preparation
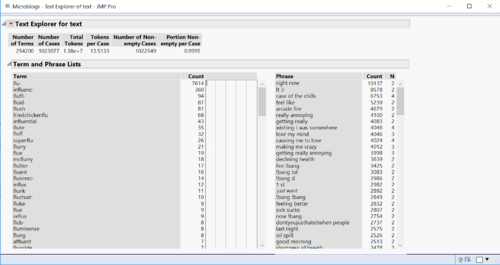
1. Extraction of relevant data: I have used the Text Explorer to analyze and extract the keywords that we need. For instance, “Flu”, “Cough”, “Fever”, “Chill”, “Cold”, and “Pain”. These keywords are indicators for us to locate the microblogs that were published by infected individuals.
2. Removal of Interference: Remove irrelevant data that involved with confusing keywords like "Fried Chicken Flu", "Heartbroken","influence" etc. These data are irrelevant while containing keywords that we mentioned above.
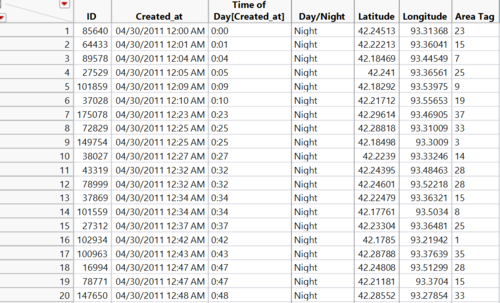
3. After the above process, I have manually split the created timestamp into date and time of the day.
4. With the cleaned dataset, I have manually split the “Location” data into two columns of Latitude and Longitude in Excel. Moreover, I have binned the time of day into two categories: Day time (8:00 a.m. – 6:00 p.m.) and Night time (6:00 p.m. – 8:00 p.m.). This process is meant for further analysis of people’s daytime and nighttime moving patterns by its GPS location.
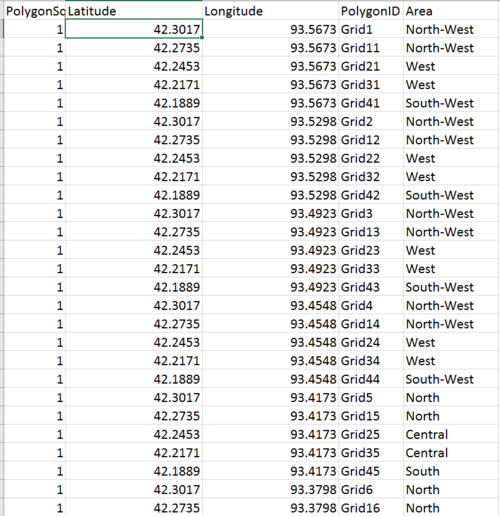
5. Additionally, to create a polygon diagram, I have binned the longitude into 10 bins and latitude into 5 bins. By categorizing the latitude and longitude, we can build up a 5*10 matrix. Each area has a unique grid code, while grid 14, 15,16, 24, 25, 26 are re-coded as "Central" area as they have covered the Downtown and Uptown regions. Other areas are re-coded by their orientations.For instance, "North", "North-East", "North-west", "West", "East", "South", "South-East", "South-West".


