1718t1is428T12 Proposal 1
| Version 1 | Version 2 |
Contents
Introduction & Motivation
In data analytics and visualization, there are unique challenges faced in the security realm as compared to conventional Business Intelligence analytics; rare incidents (i.e. attacks) within massive volumes of data need to be detected. Organizations commonly use Security Information and Event Management (SIEM) software solutions to gather security events from various systems and logs, by deploying real-time alert tools optimized to do event-driven signature matching for a subset of the overall gathered data. As attacks are more sophisticated these days, threats are more difficult to detect with signature-based systems.
Extensive analytics can complement SIEM solutions to identify major anomalies, combine multiple markers of attackers’ actions, and detect customized infections. Identifying malicious behavior is challenging, as we do not always know what we are looking for — anomalous behaviors must be an attack, and some attack signatures are unknown and not upfront, so it is crucial to present findings to security analysts for human-driven analysis.
Objectives
Security analysts may not be data science specialists, so the use of visual data representation and visual analytics can make security data analytics easier to understand. The aim of the project is to help organizations identify high-level security threats and attacks by analyzing large amounts of security data (i.e. firewall and IDS logs) we have collected, such that security analysts are able to deal with such threats and attacks with the findings without being required to have strong data science proficiency.
This project tells a story of an attack on a large organization and the three main objectives are:
- Discovering key incidents that took place for the time period recorded in the firewall and IDS logs.
- Recognizing a security trend in the firewall and IDS logs over the course of the time period.
- Identifying the root causes of the incidents identified. And bearing in mind that corporate networks cannot be shut down or disconnected from the internet, what can done to mitigate the issues.
Background Survey of Related Works
| Visualizations | Explanation |
|---|---|
|
|
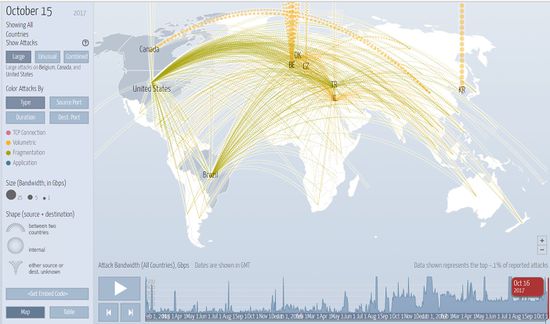
Digital Attack Map is a live data visualization of DDoS attacks around the globe, built through a collaboration between Google Ideas and Arbor Networks. The tool surfaces anonymous attack traffic data to let users explore historic trends and find reports of outages happening on a given day. |
|
|
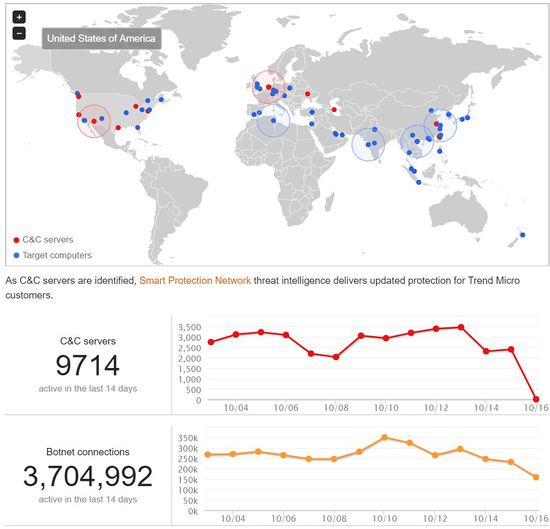
Global botnet threat activity map by Trend Micro shows the monitored malicious network activity to identify command-and-control servers. It enables security analyst to identify which computers are being attack how many often over the past 2 weeks. |
|
|
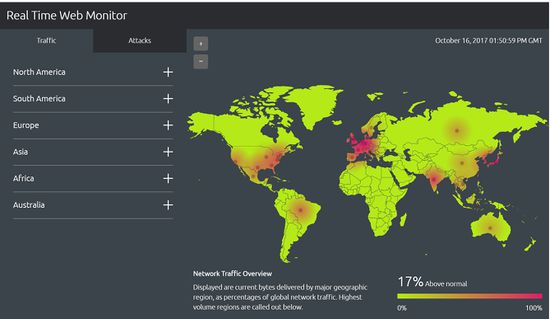
Global Internet conditions map by Akamai. With this real-time data they identify the global regions target of the greatest web attack traffic, cities with the slowest web connections (latency) and geographic areas with the most web traffic (traffic density). |
Datasets
Tools / Libraries
- Tableau
- Github
- Microsoft Excel
- Adobe Creative Suites
- Sketch
- Javascript: sigma.js, vis.js, three.js, D3.js
- Python
Technical Challenges
| Key Technical Challenges | Detailed Description | Proposed Solution |
|---|---|---|
|
D3.js is a JavaScript library for producing dynamic, interactive data visualizations in web browsers. |
| |
|
The data set are in text format and many other different format. Integration are challenging as there are a lot of manual work to be done. |
| |
|
Many actual security attacks and defense data are paid version. |
| |
|
In order to enable users to understand the data sets, interactive elements needs to be suitable for this project |
|
Project Timeline & Task Assignments
References
- Databases: http://vizsec.org/data/
- Botnet Dataset: https://www.uvic.ca/engineering/ece/isot/datasets/
- D3.js: https://d3js.org/
- Detect virus: https://www.virustotal.com
Comments
Please leave comments here.


