1718t1is428T10 Proposal
Contents
Problem and Motivation
Based on the 2016 Marketing Report by Singapore Tourism Board (STB), STB has plans to grow Singapore’s tourism industry. One of the key questions whilst analyzing their market portfolio was how they could determine the growth potential for our current and potential markets.
Presently, close to 80% of Singapore’s visitor arrivals originate from the Asia Pacific region, which may potentially present a challenge should these markets eventually reach a saturation point. It is therefore important to examine whether there are still opportunities for growth and whether Singapore is able to maximize its market share in these countries in order to sustain its growth. This growth potential would be affected by macroeconomic factors, international connectivity in terms of air travel, as well as outbound travel trends in each of the markets. We would therefore evaluate these in order to determine future potential in the respective markets.
In addition, we would be looking into the market share the Singapore is able to capture in its Top 15 visitor arrival countries. Specifically, as Indonesia, China, and India rank as the top three countries that are contributing to Singapore’s booming tourism sector, we seek to delve deeper in order to find out the actual populations within these visitor countries in order to find out whether there is still potential in the form of market share that STB could capture. This would then determine the appropriate strategies that STB should take in order to ensure continued growth - should resources be allocated to investments in these markets to continue to drive demand? Or should STB start look at how it can diversify its market portfolio beyond Asia?
Has Singapore really won majority of their citizens over? This project seeks to provide an interactive visualization to aid in deriving more information.
Objectives
This project aims to achieve the following objectives:
- Understand which countries are sending the most tourists to Singapore
- Analyse the proportion of tourists coming to Singapore against the total outbound residents of the country
- Compare the expenditure and income patterns of these tourists
- Drill-down on the exact expenditure items
Background Survey of Related Works
| Visualizations | Explaination |
|---|---|
|
|
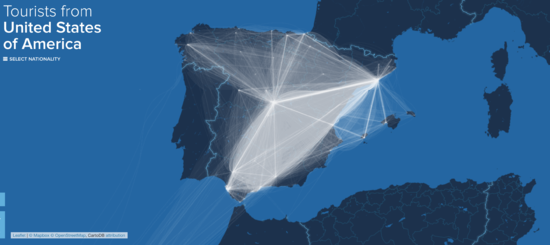
This visualisation enables the viewer to find out the countries that the tourists are coming from. This, combined with the thickness of the line to represent the relative number of tourists compared to the other countries will enable us to have a quick and clear overview. Additionally, the team will look into customising this current chart, to allow for a more detailed view of each countries' actual proportion of tourists that are coming into Singapore compared to the other countries being visited. |
|
|
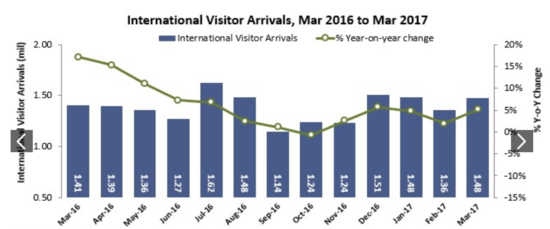
This visualisation comprises of two charts in one - a time-series line chart, and a bar chart, which compares the international visitor arrival with the year on year change. Despite the limitations with this visualisation (seemingly confusing), the team feels that it is necessary to give a broad overview of the overall trend in relation to the total number of visitors. Additionally, it would be good to subsequently break this down to enable zooming into a certain country's monthly changes. |
|
|
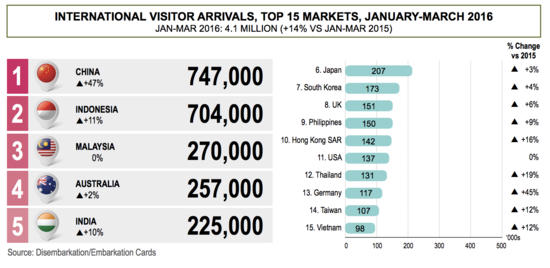
The bar chart allow user to compare data between the countries. Next to each bar, we will indicate whether the number of visitors increases or decreases from the previous year, and how much different is the percentage. This chart is to let our user get a rough gauge of the number of visitors to Singapore. |
|
|
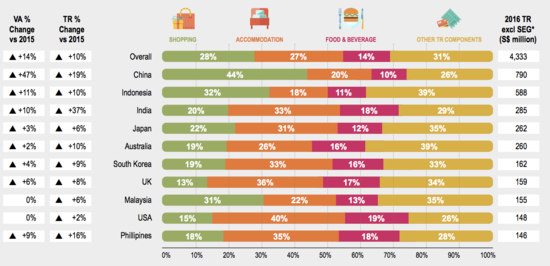
The used of stacked horizontal bar charts is an effective way of demonstrating the distribution of tourists by country. The columns allow us to show the net change in visitors to Singapore, on whether it's increased or decreased with respect to the changes in population. This chart allows users to understand the proportion of overseas visitors to Singapore in contrast to other destinations they have traveled to. |
Tools / Libraries
Datasets
We have chosen the following datasets to do data discovery:
| Dataset | Rationale |
|---|---|
| |
| |
|
Technical Challenges
| Key Technical Challenges | Proposed Solution |
|---|---|
| |
| |
| |
| |
|
Roles & Milestones
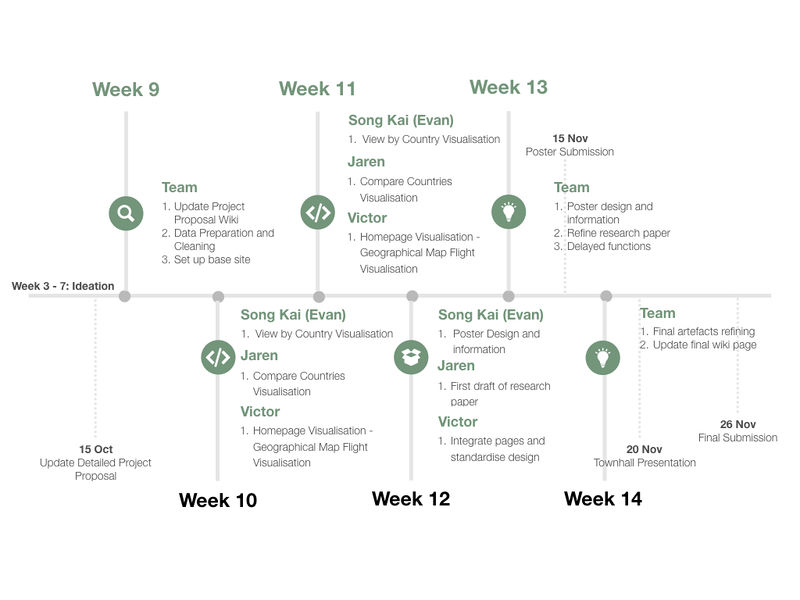
- Project Timeline
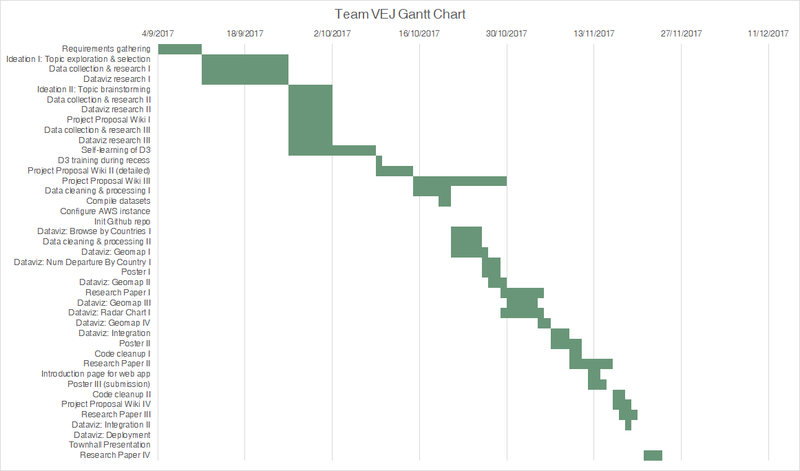
- Gantt Chart
References
- D3.js: https://d3js.org/
- Singapore Inbound Tourism Data: https://www.stb.gov.sg/statistics-and-market-insights/Pages/statistics-Visitor-Arrivals.aspx
- Singapore Tourism Board Marketing Strategy Report 2016: https://www.stb.gov.sg/news-and-publications/publications/Documents/Marketing_Strategy-Of_Stories_Fans_and_Channels.pdf
- CEIC Database: https://www.ceicdata.com/en
Comments
Feel free to leave comments / suggestions!

