1718t1is428T8
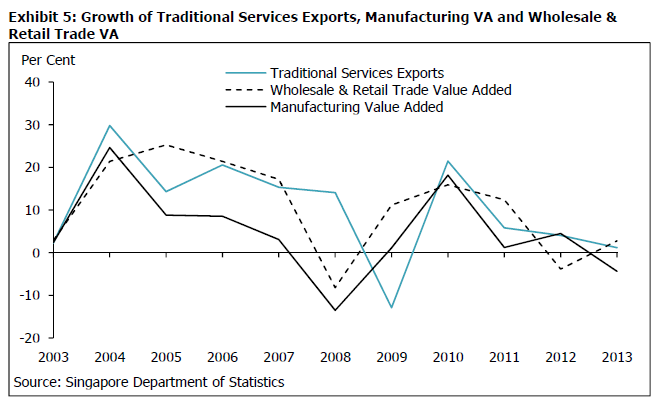
The international exports and imports of services has played an increasingly important role in Singapore over the last decade, with 70% of the nation’s GDP comprising of service industries such as finance, insurance and wholesale retail trade, up from 64% 10 years ago. This is contrasted to the decline of the share of manufacturing in the economy, down from 26% to 19% in the same period.
As government bodies such as the Ministry of Trade and Industry (MTI) and Innovation and Enterprise (IE) Singapore focus more on these industries in their development plans, there comes the need to continuously view the trends and components of our services exports. This will allow us to understand the growth trends of this critical aspect of Singapore’s economy, its individual components and the countries that contribute to it and finally to monitor the effects of existing initiatives from various government agencies. Through
After reviewing the existing reports prepared by MTI and similar graphs reported by the Straits Times, we identified the following areas in which we plan our visualization to value-add to:
1) Interactivity and Customisability - By allowing the reader to interact with the graph to filter periods to view as well as the level of detail. This will facilitate user-led investigation and exploration of the data without any data processing tools.
2) Professional and ready to use format – This will save stakeholders such as MTI and SPH time in the preparation of graphs, especially when graph formatting is necessary before release to the public.

This will provide a one stop visualization for stakeholders in the services industry in Singapore, to quickly consume the aspects of this data that is relevant to them, in an aesthetically pleasing and intuitive manner.
We are using the following two datasets from the Singapore Department of Statistics:
Exports Of Services By Major Trading Partner And Services Category, Annual Dataset
Imports Of Services By Major Trading Partner And Services Category, Annual Dataset
The dataset consists of the following columns:
- match_id - INTEGER, unique match id
- match_seq_num - INTEGER, match sequence number
- radiant_win - STRING, boolean variable than indicates if radiant won or not in the match
To meet the required objectives of customisability and interactivity, we drew our inspiration from Mike Bostock's Visualisation on Baseball Strikeouts. We would like to reproduce his method of incorporating the many components of a time series visualisation into one graph, hidden in the background of the overall trend, as well as the ability to select a component to view when needed.
File:Strikeouts on the Rise.png
Trend Over Time
Our plan is to produce a similar visualisation, with countries instead of baseball players and exports or imports of services instead of strikeouts. This will allow us to view the long-term trend of this dataset while viewing the individual country data in the background, as well as allowing selection and highlighting of individual countries upon request.
For additional customisability, we will include filters to toggle between viewing the absolute Exports in services, the percentage change over the years and selection of imports or exports. On top of that, to facilitate country selection, we will have a bar graph on the right denoting the measure selected, such as exports, by each individual country. This bar graph will be linked to the time series chart, allowing us to quickly view and select, for example, the largest country that imports Singapore's services and quickly highlight it on the main chart.
Components Analysis
In addition to analysing the trends of each country over time, another area of interest is in the components mix of our services imports and exports. In a particular year, how much each service industry contributed to the overall imports/exports, and also which countries were responsible for this. To visualise this multi-level data, we chose the Chord Diagram for its ability to visualise multiple quantitative relatonships in an intuitive manner.
The following are some of the key technical challenges that we may face throughout the course of the project:
| Key Technical Challenges | Plans to resolve these issues |
|---|---|
| |
|
The timeline for this project until its completion is as follows:
The tools and technologies we will be using for this project:
- Data Cleaning
- Excel
- JMP
- R
- Data Visualization
- D3.js
Please give us feedbacks! Thank you!


