1718t1is428T15
|
PROJECT PROPOSAL |
Contents
Project Motivation
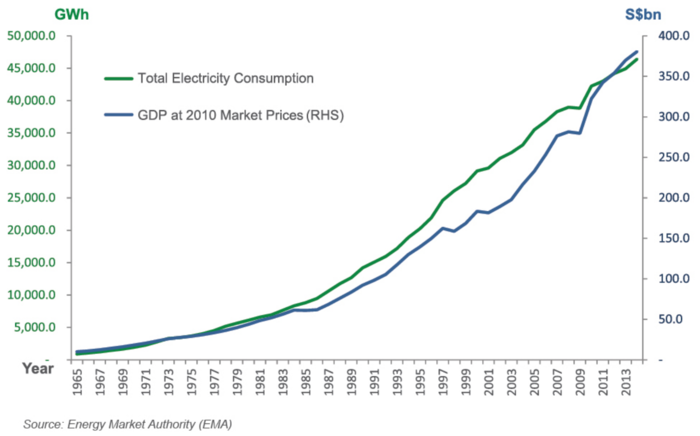
Experts have warned that power demand is set to double by 2030 globally despite authoritative control. High power consumption can already be observed locally. According Energy Market Authority (EMA), Singapore has faced increasing power consumption from 1965 to 2013 [1].
As Singapore is land-scarce and does not have significant renewable energy options such as hydro-power, wave, or sufficient land for mass solar energy production, energy has been a top concern in the urban nation[2]. It is thus important to promote energy saving concepts to the public as well as deploying energy saving solution island wide. However, the usual analysis tools are not enough to provide a different perspective to facilitate the deployment of the solution. Information about the energy consumption levels of residents in Singapore are often not conveyed adequately enough in data visualisation. While EMA and Singstat provide annual data and reports on energy usage in Singapore, a powerful visualisation technique should be used to gain insights effectively.
Project Objective
Our team aims to create a visualisation that leverages on energy datasets provided by EMA to perform spatial analysis to identify energy usage clusters with hexagonal binning.
Dataset
Data Source
The analysis will be based on EMA dataset:
- Public housing's average monthly household electricity consumption (kwh) (2013 - 2015)
- Private apartment's average monthly household electricity consumption (kwh) (2013 - 2015)
Data Attributes
Public Housing
- Postal code
- 1-room
- 2-room
- 3-room
- 4-room
- 5-room/executive
Private Apartment
- Postal code
- Jan
- Feb
- Mar
- Apr
- May
- Jun
- Jul
- Aug
- Sep
- Oct
- Nov
- Dec
Related Works
Inspirations
EMA publishes energy statistics on an annual basis to provide readers with a comprehensive understanding of the Singapore energy landscape through a detailed coverage of various energy-related topics. As project Enerlyst focuses on analysing households' energy consumption, only private and public households data will be used. This study will be based on EMA dataset from 2013 to 2015. 2013 data will be prepared manually whereas 2014 and 2015 data will be uploaded to the application and process on the fly.
Proposed Storyboard
Technical Challenges
Timeline
| Week No(s). | Task | Status |
|---|---|---|
| Prepares Project Proposal | Completed | |
| Attend D3.js workshop, research on technologies/tools and project wiki | Completed | |
| Clean data, start visualisation | Incomplete | |
| Continue with visualisation | Incomplete | |
| Prepare poster, final report and wiki page | Incomplete | |
| Poster submission and final deliverables | Incomplete |
Technologies/Tools
The following are technologies and tools which we used:
- Microsoft Excel
- D3.js
- Leaflet
- Github
Reference
Comments

