IS428 2017-18 T1 Assign Tan Wei Jie Amos
Contents
Overview
Mistford is a mid-size city is located to the southwest of a large nature preserve. The city has a small industrial area with four light-manufacturing endeavors. Mitch Vogel is a post-doc student studying ornithology at Mistford College and has been discovering signs that the number of nesting pairs of the Rose-Crested Blue Pipit, a popular local bird due to its attractive plumage and pleasant songs, is decreasing! The decrease is sufficiently significant that the Pangera Ornithology Conservation Society is sponsoring Mitch to undertake additional studies to identify the possible reasons. Mitch is gaining access to several datasets that may help him in his work, and he has asked you (and your colleagues) as experts in visual analytics to help him analyze these datasets.
Mitch Vogel was immediately suspicious of the noxious gases just pouring out of the smokestacks from the four manufacturing factories south of the nature preserve. He was almost certain that all of these companies are contributing to the downfall of the poor Rose-crested Blue Pipit bird. But when he talked to company representatives and workers, they all seem to be nice people and actually pretty respectful of the environment.
Companies
Roadrunner Fitness Electronics produces personal fitness trackers, heart rate monitors, headlamps, GPS watches, and other sport-related consumer electronics.
Kasios Office Furtniture manufactures metal and composite-wood office furniture including desks, tables, and chairs.
Radiance ColourTek produces solvent based optically variable metallic flake paints with the lowest volatile organic compounds in industry.
Indigo Sol Boards produces skateboards and snowboards and has seen modest growth in recent years.
Chemicals
Appluimonia is an airborne odor is caused by a substance in the air that you can smell. While it does not cause serious injury, long-term health effect, or death to humans or animals, it may affect the quality of life and sense of well-being.
Chlorodinine is a corrosive that can attack and chemically destroy exposed body tissues as soon as it touches the skin, eyes, respiratory tract or digestive tract. It is thus harmful if inhaled or swallowed. Chlorodinine is used as a disinfectant and sterilizing agent as well as other uses.
Methylosmolene is a trade name for a family of volatile organic solvents. Several studies have documented the toxic side effects of Methylosmolene in vertebrates, and the use of it in manufacturing is strictly regulated. Liquid forms of Methylosmolene are required by law to be chemically neutralized before disposal.
AGOC-3A has been developed under new environmental regulations and consumer demand for low-VOC and zero-VOC solvents. It is less harmful to human and environmental health.
Question 1
Characterize the sensors’ performance and operation. Are they all working properly at all times? Can you detect any unexpected behaviors of the sensors through analyzing the readings they capture?
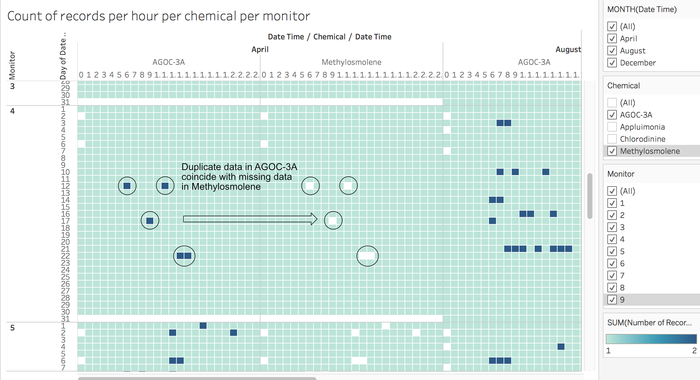
- From the calendar chart we observe that in the sensor readings there are duplicate data as well as missing data. In all sensors across the three months, there is a common pattern of missing data on 2nd, 6th and/or 7th day of each month at 12am.
- On closer inspection, it is observed that majority (besides the earlier observation) of duplicate and missing data tend to occur for readings of the chemical “AGOC-3A” and “Methylosmolene”.
- It is also observed that the duplicate data in “AGOC-3A” tend also coincides with the missing data in “Methylosmolene”. This tells us that the errors in the data are most likely to be not random.
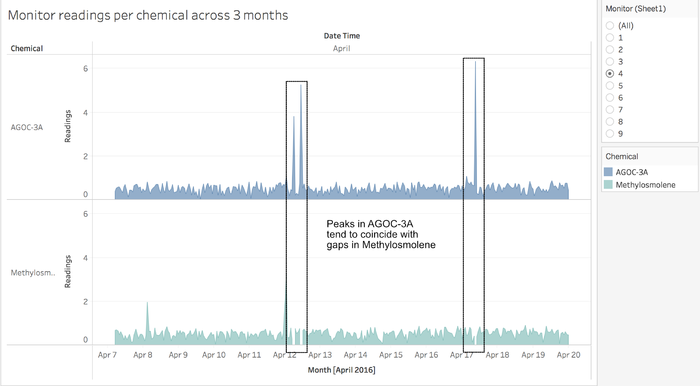
- To see how the duplicate data affects the readings for each chemical, an area chart is also constructed for each chemical reading per sensor over three months to observe the gaps in data. To make the gaps more obvious, the readings is square rooted to make the smaller readings more pronounced. Observing 12th April and 17th April for Monitor 4 and for chemicals “AGOC-3A” and “Methylosmolene”, we see that the local peaks in “AGOC-3A” also coincides with the missing data in “Methylosmolene”.
- To fix the data, I wrote a python script that reassigns each duplicate data to either “AGOC-3A” or “Methylosmolene”, whichever assignment has the least sum of squared z-scores.
- After fixing the data, it is observed that now “AGOC-3A” has higher peaks as compared to “Methylosmolene”.
- Looking at all the distribution of chemical readings per monitor using a box plot chart, a strange phenomenon can be observed of monitor 4 – While the distribution of chemical readings for each each other monitor remains similar across each month. Monitor 4 exhibits an increase of readings across each month. I assume that Monitor 4 may be faulty. We may need to take precaution when doing future analysis.
Question 2
Now turn your attention to the chemicals themselves. Which chemicals are being detected by the sensor group? What patterns of chemical releases do you see, as being reported in the data?
- Using another calendar chart to plot the intensity of readings for each chemical per week day across 24 hours. It seems that increase levels of “Methylosmolene” tend to occur every day from 9PM to 5AM. While increased levels of “AGOC-3A” tend to occur around 6AM to 9PM
- Using a box-and-whisker plot to plot the chemical readings recorded per monitor, it is observed that monitors 3 and 4 exhibit a similar distribution of chemical readings (both higher percentile values as compared to the other monitors).
- The top 3 Monitors with higher values of “Methylosmolene” recorded compared to the other monitors are 2, 3 and 6 with values 58.5, 76.0 and 100.8 respectively , suggesting that either factory Roadrunner or Kaisos may have been the contributor of the chemical.
Question 3
Which factories are responsible for which chemical releases? Carefully describe how you determined this using all the data you have available. For the factories you identified, describe any observed patterns of operation revealed in the data.
In order to identify which factory is a contributor of chemicals, we need to overlay the map with wind cones pointing from the sensors in the opposite direction of the wind. An overlay of several wind cones should highlight the factory that could be the culprit.
- To complete the spatial chart, first we need to produce a table similar to this. The path indicates to tableau the order in which to draw the polygons we will be using for the spatial analysis. A python script is used to generate the table.
- The length of the triangle is determined by translating the windspeed in m/s into miles/hour and then onto the 200 x 200 grid. The length scale is a factor to allow the user to lengthen or shorten the length of the triangle.
- In order to make the triangles point in the potential source of the chemicals, we add or deduct 180 degrees from the given wind direction.
- To plot the X and Y coordinates of the triangle, the following formula is used. The parameter angle is used to determine the arc of the triangle which is adjustable by the user.
- We then drag the Date into the pages tile in tableau and toggle the “all feature” under history to display all the triangles.
- To ensure that only the triangles with significant values show up, we use the value threshold is determined by the constructing a box-and-whisker plot of all distributions of chemicals across 3 months. We then arrive on conclusion to use all readings that are above 3.5
Analysis
For each chemical type we calculate an overlay of all wind cones to determine which factories are possible emitters of the chemicals
AGOC-3A Roadrunner and Kaisos
Applumonia Roadrunner, Kaisos and Indigo
Chlorodine Kaisos
Methylosmolene Roadrunner
Citations & Credits
Comments
..

