File:Reading levels by sensors over time.png
Revision as of 01:41, 8 October 2017 by Yongjin.tan.2014 (talk | contribs) (Show the reading levels of all chemicals from all sensors over the 3 provided months)
No higher resolution available.
Reading_levels_by_sensors_over_time.png (381 × 343 pixels, file size: 19 KB, MIME type: image/png)
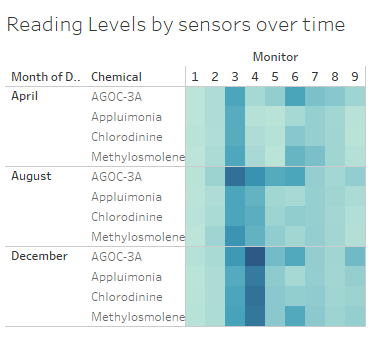
Show the reading levels of all chemicals from all sensors over the 3 provided months
File history
Click on a date/time to view the file as it appeared at that time.
| Date/Time | Thumbnail | Dimensions | User | Comment | |
|---|---|---|---|---|---|
| current | 01:41, 8 October 2017 | | 381 × 343 (19 KB) | Yongjin.tan.2014 (talk | contribs) | Show the reading levels of all chemicals from all sensors over the 3 provided months |
- You cannot overwrite this file.
File usage
The following page links to this file: