Task 2 Findings
Now turn your attention to the chemicals themselves. Which chemicals are being detected by the sensor group? What patterns of chemical releases do you see, as being reported in the data? Limit your response to no more than 6 images and 500 words.
| Problem #1 |
Increasing Growth Trend
|
| Issue |
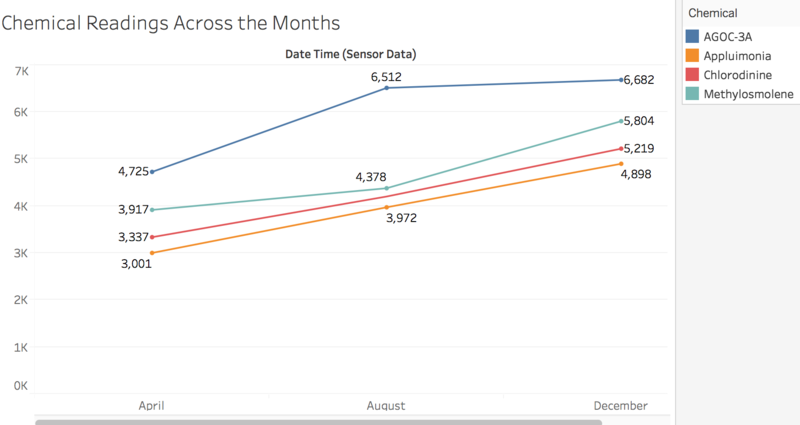
Across the three months, each chemical is increasing in sum of readings. Appluimonia is increasing at an increasing rate , Cholorodinine and Methylosmolene are increasing at a constant rate and AGOC-3A is increasing at a decreasing rate. For all three months, the ranking in terms of highest readings starts from AGOC-3A, followed by Methylosmolene, Chlorodinine and lastly Appluimonia. However, based on our previous discovery that AGOC-3A has duplicated readings and Methylosmolene has missing data, the graph would show AGOC-3A lower and Methylosmolene higher.
|
| Solution |
|
| Problem #2 |
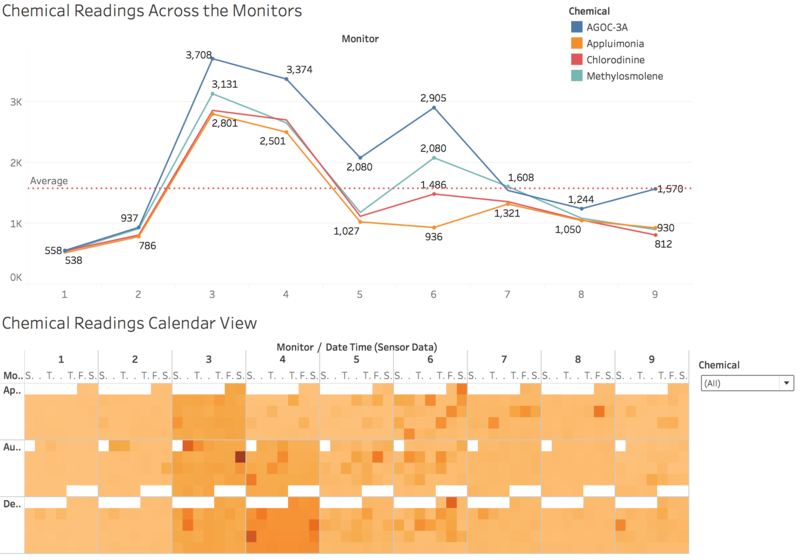
Relatively High levels of chemicals found in Sensor 3 and 4
|
| Issue |
With chemical filters, we see Appluomonia and Cholordinine being the major cause of high ratings. Apart from that, there are many random spikes of records across the chemicals.
|
| Solution |
|
| Problem #3 |
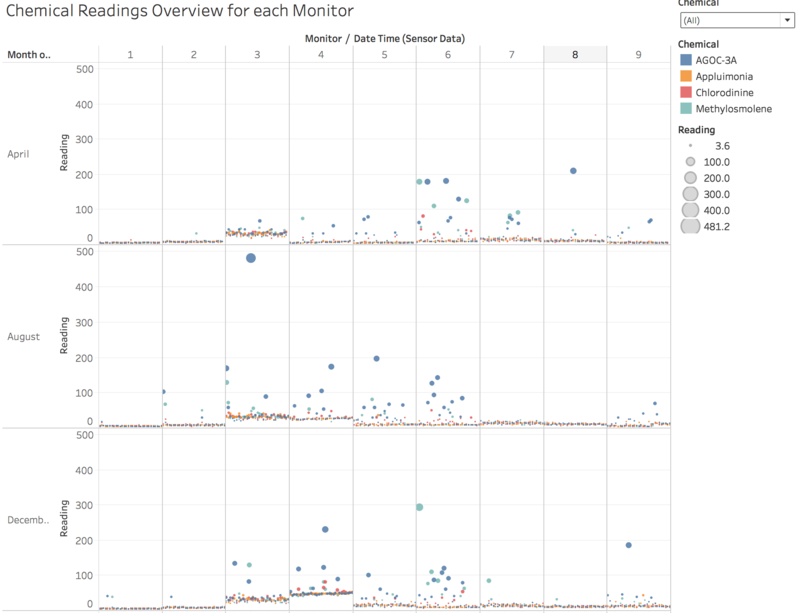
Metholosmolene has one of the bigger readings across sensor 3-7
|
| Issue |
Though the diagram may show AGOC-3A as the domineering chemical, however from our previous observations we know that the readings belong to Metholosmolene. Hence, taking that into account along with the bigger sized circle on the chart, Metholosmolene is the most pervasive chemical.
|
| Solution |
|


