1718t1is428T7: Proposal 2
|
Drug trafficking is a global illicit trading involving the cultivation, manufacture, distribution and sales of substances which are subject to drug prohibition laws. The consequences of illicit drug use are widespread, causing permanent physical and emotional damage to users and negatively impacting their families, coworkers, and many others with whom they have contact. Singapore will continue to maintain a tough stance and step up efforts in fighting against drug, said Home Affairs and Law Minister K Shanmugam, during a marathon session of parliament on April 30, 2017. With Singapore geographical proximity to the Golden Triangle, Singapore is a major transport hub and is vulnerable to drug syndicates. |
With this project we aim to create visualizations that will allow the easy visual analysis of the following:
|
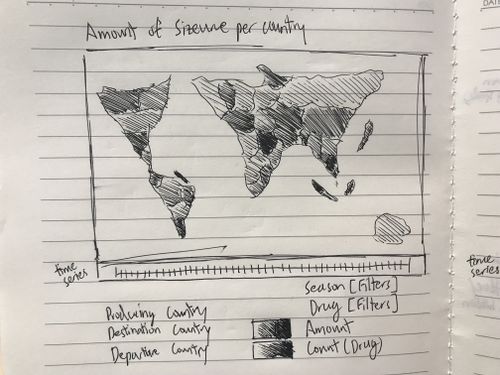
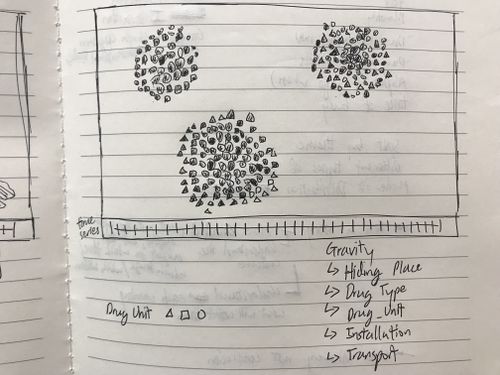
Mighty Morphine Power Rangers wants to explore the current drug route and be able to draw some observations on the different drug routes taken, methods used to conceal the drugs, the most active region and the most active day of drug trafficking. | |
|
Datasets are retrieved from https://data.unodc.org/#state:1
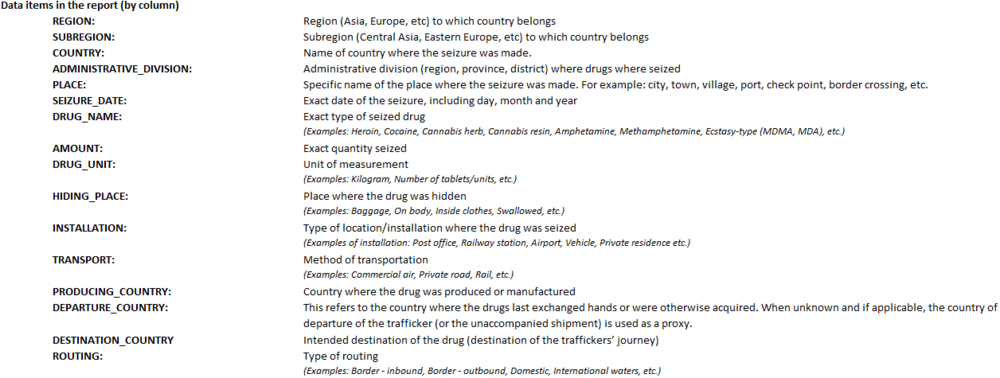
This dataset provide a detailed information of each drug seizure:
Data Information
| Screenshots | What we can learn |
|
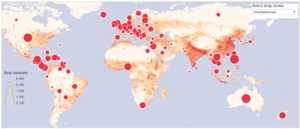
Interactive Filled World Map |
Example shows the different intensity of percentage of the population affected by drug abuse and the total number of drug abusers as shape circle.
Cons:
|
|
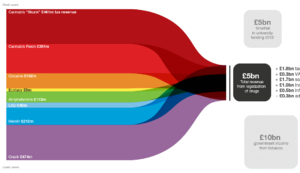
Stacked Distribution Pipeline |
Example showcase a beautifully designed stacked bar, showing the ratio of revenue brought in by each type of drug that fuels the different types of activities at the right end of the chart.
Cons:
|
|
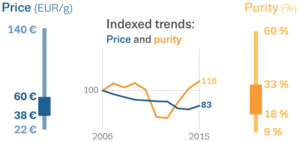
Price OHLC |
Example shows the price level, high and low for a type of drug along the years.
Cons:
|
|
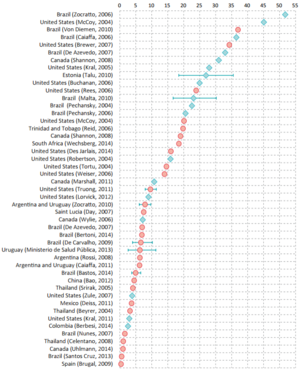
Drug Prevalence Boxplot |
Example shows the prevalence of a drug abuse in each country
Cons:
|
| Screenshots | What we can learn |
|
Example shows the different intensity of percentage of the population affected by drug abuse and the total number of drug abusers as shape circle.
Cons:
| |
|
Example showcase a beautifully designed stacked bar, showing the ratio of revenue brought in by each type of drug that fuels the different types of activities at the right end of the chart.
Cons:
|
Inexperienced with data visualisation tools
- Self learning through youtube and practices.
- Peer learning
New to D3.js and Javascript
- Attend D3.js workshop.
- Self explore the various D3.js examples.
Data cleaning and transformation
- Team effort
- Documentation to keep track of changes.
Please leave your comments here :)
