Difference between revisions of "1718t1is428T6 Proposal"
Jypeh.2015 (talk | contribs) |
Jypeh.2015 (talk | contribs) |
||
| Line 52: | Line 52: | ||
<br/><div style="background: #364558; padding: 15px; font-weight: bold; line-height: 0.3em; text-indent: 15px;letter-spacing:-0.08em;font-size:20px"><font color=#fbfcfd face="Century Gothic">BACKGROUND SURVEY OF RELATED WORKS</font></div> | <br/><div style="background: #364558; padding: 15px; font-weight: bold; line-height: 0.3em; text-indent: 15px;letter-spacing:-0.08em;font-size:20px"><font color=#fbfcfd face="Century Gothic">BACKGROUND SURVEY OF RELATED WORKS</font></div> | ||
| + | TO BE ADDED 10 | ||
| + | {| class="wikitable" style="background-color:#FFFFFF;" width="100%" | ||
| + | |- | ||
| + | ! style="font-weight: bold;background: #536a87;color:#fbfcfd;width: 50%;" | Related Works | ||
| + | ! style="font-weight: bold;background: #536a87;color:#fbfcfd;" | What We Can Learn | ||
| + | |- | ||
| + | | | ||
| + | TO BE ADDED 11 | ||
| + | || | ||
| + | TO BE ADDED 12 | ||
| + | |- | ||
| + | |} | ||
| + | |||
| + | <br/><div style="background: #364558; padding: 15px; font-weight: bold; line-height: 0.3em; text-indent: 15px;letter-spacing:-0.08em;font-size:20px"><font color=#fbfcfd face="Century Gothic">DESIGN INSPIRATIONS</font></div> | ||
TO BE ADDED 10 | TO BE ADDED 10 | ||
{| class="wikitable" style="background-color:#FFFFFF;" width="100%" | {| class="wikitable" style="background-color:#FFFFFF;" width="100%" | ||
| Line 66: | Line 80: | ||
<br/><div style="background: #364558; padding: 15px; font-weight: bold; line-height: 0.3em; text-indent: 15px;letter-spacing:-0.08em;font-size:20px"><font color=#fbfcfd face="Century Gothic">PROPOSED STORYBOARD</font></div> | <br/><div style="background: #364558; padding: 15px; font-weight: bold; line-height: 0.3em; text-indent: 15px;letter-spacing:-0.08em;font-size:20px"><font color=#fbfcfd face="Century Gothic">PROPOSED STORYBOARD</font></div> | ||
| + | Other than looking at related work, we can also reference and look for inspirations from other interactive visualizations created by others. | ||
{| class="wikitable" style="background-color:#FFFFFF;" width="100%" | {| class="wikitable" style="background-color:#FFFFFF;" width="100%" | ||
|- | |- | ||
| − | ! style="font-weight: bold;background: #536a87;color:#fbfcfd;width: 50%;" | | + | ! style="font-weight: bold;background: #536a87;color:#fbfcfd;width: 50%;" | Reference of Other Interactive Visualization |
| − | ! style="font-weight: bold;background: #536a87;color:#fbfcfd;" | | + | ! style="font-weight: bold;background: #536a87;color:#fbfcfd;" | What Can We Learn? |
| + | |- | ||
| + | | <b>An analysis of property pricing in Singapore</b> <br><br> | ||
| + | [[File:JingYuan Vizili.png|500px|center]] <br> | ||
| + | Source: https://app.vizili.com/explore | ||
| + | || | ||
| + | <b>Hover over technique:</b><br> | ||
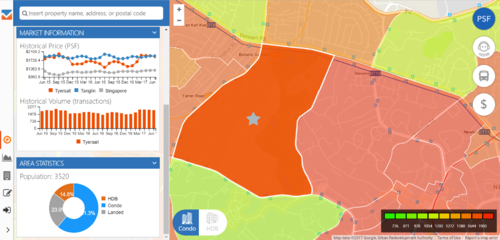
| + | By hovering over each area of the map of Singapore, the area’s property pricing charts and details such as the historical price and volume of transactions are shown. This reduces the need for user to explicitly select an area via dropdown list and click it in order for the charts to appear. | ||
| + | <br><br> | ||
| + | <b>Historical charts with comparisons:</b><br> | ||
| + | The historical charts such as the line chart shows the change in prices across many years. In addition, it shows the comparison between the sub-area, the area and Singapore. For us, we can allow users to select different sub-areas and compare their historical pricings and other details | ||
| + | |- | ||
| + | |||
| + | | <b>An analysis of taxi availability in Singapore</b> <br><br> | ||
| + | [[File:JingYuan Taxi.png|500px|center]] <br> | ||
| + | Source: https://yongquanben.github.io/sg_taxi_availability/ | ||
| + | || | ||
| + | <b>Hexagonal binning:</b><br> | ||
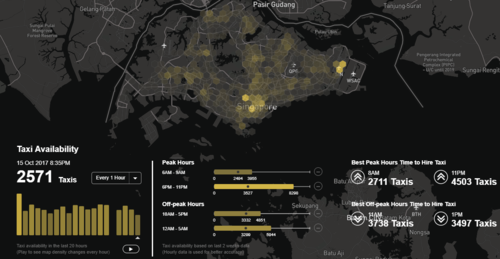
| + | By dividing the Singapore map into hexagon bins, this map drill down one step further to see the availability of taxi in that bin area instead of the entire area such as Tampines. Some of the area can be very big and it is not accurate to aggregate the taxi availability for that area. By using hexagon binning, it will reflects greater accuracy. | ||
| + | <br><br> | ||
| + | <b>Scroll-free view</b><br> | ||
| + | One good aspect of a friendly visualization is that is minimal scrolling and buttons to refer to next page. This entire visualization is scroll-free but at the same time, it contains all the necessary details for user to know the availability of taxi in Singapore. There is no need for user to scroll or press buttons too frequently and show all required information. | ||
|- | |- | ||
| − | | | + | |
| + | | <b>An analysis of home prices, sales and inventory in U.S.</b> <br><br> | ||
| + | [[File:JingYuan RedFin.png|500px|center]] <br> | ||
| + | Source: https://www.redfin.com/blog/data-center | ||
|| | || | ||
| − | + | <b>Filter:</b><br> | |
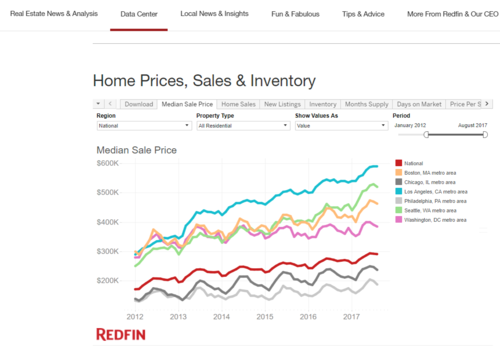
| + | With filter, it allows the users to view the different property types’ pricing. As most users usually want to buy only a certain type of property, it is incorrect to aggregate the prices of all different property types’ pricing and show it to the user. | ||
|- | |- | ||
|} | |} | ||
Revision as of 14:26, 15 October 2017
TO BE ADDED
TO BE ADDED
TO BE ADDED
| Dataset/Source | Data Attributes | Rationale Of Usage |
|---|---|---|
| TO BE ADDED 1 |
TO BE ADDED 2 |
TO BE ADDED 3 |
|
TO BE ADDED 4 |
TO BE ADDED 5 |
TO BE ADDED 6 |
|
TO BE ADDED 7 |
TO BE ADDED 8 |
TO BE ADDED 9 |
TO BE ADDED 10
| Related Works | What We Can Learn |
|---|---|
|
TO BE ADDED 11 |
TO BE ADDED 12 |
TO BE ADDED 10
| Related Works | What We Can Learn |
|---|---|
|
TO BE ADDED 11 |
TO BE ADDED 12 |
Other than looking at related work, we can also reference and look for inspirations from other interactive visualizations created by others.
| Reference of Other Interactive Visualization | What Can We Learn? |
|---|---|
| An analysis of property pricing in Singapore Source: https://app.vizili.com/explore |
Hover over technique: |
| An analysis of taxi availability in Singapore |
Hexagonal binning: |
| An analysis of home prices, sales and inventory in U.S. |
Filter: |
The following are some of the key technical challenges that we may face throughout the course of the project:
| Key Technical Challenges | How We Propose To Resolve |
|---|---|
|
TO BE ADDED 15 |
TO BE ADDED 16 |
The following shows our project timeline for the completion of this project:
The following are some of the tools/technologies that we will be utilizing during the project:
TO BE ADDED 17
TO BE ADDED 18
The following show the proposed storyboard that we designed during our brainstorming sessions:
ADD PICTURE TO BE ADDED 19
All comments are welcomed


