Difference between revisions of "1718t1is428T7"
| Line 154: | Line 154: | ||
==<div style="background: #ffffff; padding: 17px; line-height: 0.1em; text-indent: 10px; font-size:17px; font-family: Helvetica; border-left:8px solid #0091b3"><font color= #000000><strong>References</strong></font></div>== | ==<div style="background: #ffffff; padding: 17px; line-height: 0.1em; text-indent: 10px; font-size:17px; font-family: Helvetica; border-left:8px solid #0091b3"><font color= #000000><strong>References</strong></font></div>== | ||
<div style="margin:0px; padding: 10px; background: #f2f4f4; font-family: Open Sans, Arial, sans-serif; border-radius: 7px; text-align:left"> | <div style="margin:0px; padding: 10px; background: #f2f4f4; font-family: Open Sans, Arial, sans-serif; border-radius: 7px; text-align:left"> | ||
| − | * | + | *https://data.unodc.org/ |
| − | * | + | *https://golearn-archive.unodc.org/olat/raw/static/unodc/cube/attempts.html# |
| + | *http://www.emcdda.europa.eu/data/stats2017_en | ||
| + | *https://d3js.org/ | ||
| + | *http://www.chartjs.org/ | ||
</div> | </div> | ||
Revision as of 10:55, 13 October 2017
Contents
Problem and Motivation
TEXT
TEXT
TEXT
Objectives
TEXT
TEXT
Data Source
Datasets are retrieved from https://data.unodc.org/ and http://www.emcdda.europa.eu/data/stats2017_en.
These two sites provides comprehensive and diverse data regarding drugs.
Data Snippet

References to Related Work
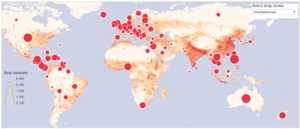
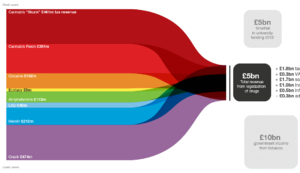
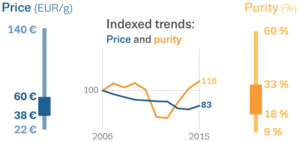
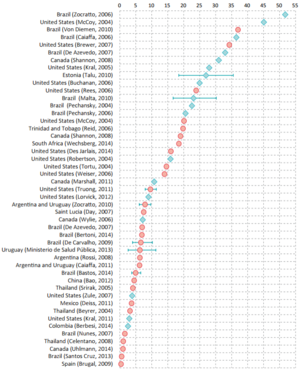
| Screenshots | What we can learn |
|
Interactive Filled World Map |
Pros: Cons: |
|
Stacked Distribution Pipeline |
Pros: Cons: |
|
Price OHLC |
Pros: Cons: |
|
Drug Prevalence Boxplot |
ABCABCABCABCABCABCABCABCABCABCABCABCABCABCABCABCABCABCABCABCABCABCABCABCABCABCABCABCAB Cons: |
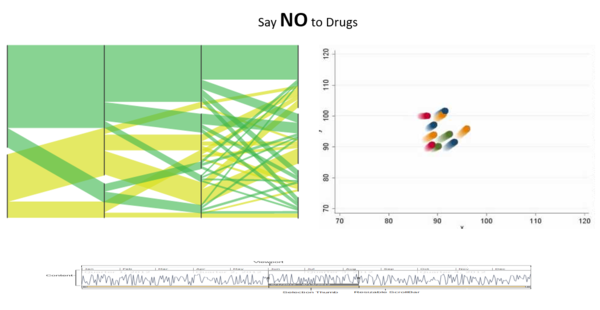
Storyboard
Key Technical Challenges
Inexperienced with data visualisation tools
New to D3.js and Javascript
Data cleaning and transformation
Project Schedule
Tools/Technologies
These are the tools and technologies that we will be learning and implementing for this project:
- Tableau
- Microsoft Excel
- D3.js
- Chart.js
- AngularJS
References
Our Team
Group 7
Fan Kaiyang
Mark Ng Wei Jie
Gary Quek Jian Zhang

