Group 4 - Data Preparation
Revision as of 23:48, 6 August 2017 by Sanghavyb.2016 (talk | contribs)
ISSS608 Visual Analytics and Applications - Project
EXPLORING AND VISUALIZING SPATIO-TEMPORAL PATTERNS OF SELF-INFLICTED DEATHS IN INDIA FROM 2001-2012 USING R
Dataset Overview
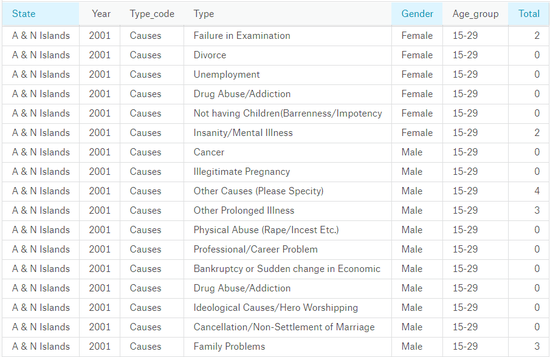
The dataset – “Suicides in India” is downloaded from Kaggle uploaded by Rajanand Ilangovan. The dataset contains the suicides committed from 2001 – 2012. The structure of dataset is shown in the screenshot provided below:

The variables and their description:
| Variable | Description |
|---|---|
| State | Lists the 29 states and 7 union territories in India |
| Year | Shows the year ranging from 2001 – 2012 |
| Type_code | Categorizes as cause of act, means adopted, educational profile, social status and professional profile of the victim |
| Type | Describes the Type_code in detail |
| Gender | Either male or female |
| Age-group | Shows the age range of the victims |
| Total | Provides the number of victims |
Data Preparation
- Certain States' names appear abbreviated, renaming them with their full forms could be highly helpful in interpretation.
[[Image: G4prep1.jpg|center]] [[Image: G4prep2.jpg|center]]
- Moreover, there is discrepancy in 'Type' column for 2 values which are corrected as shown
[[Image: G4prep3.jpg|center]]
[[Image: G4prep5.jpg|center]]
- There are certain causes which are not properly captured and are not specific enough to be added in the analysis. Also, the States column includes aggregations which are should be removed. A separate data frame is created after removing these variables.
[[Image: G4prep4.jpg|center]]

