Group 4 - Report
ISSS608 Visual Analytics and Applications - Project
EXPLORING AND VISUALIZING SPATIO-TEMPORAL PATTERNS OF SELF-INFLICTED DEATHS IN INDIA FROM 2001-2012 USING R
Contents
Abstract
India covers around 17.8% of world population, about 800,000 people commit suicide worldwide every year, and out of this 17% are Indian residents. This is a huge number especially for a developing nation like India it can hamper its growth. As the world is moving towards Smart Nations, India being one of them being enrolled into it, there is high need to educate the people on the consequences of such an act.
From our analysis, we will try to find out the patterns and various factors that lie behind such an action that becomes vital to one’s life. This will help the government officials and NGOs to identify and understand the potential victim and help the society to overcome this situation. This will help them plan different programs to run at different levels in order to enable them to fight the situation in a better way.
The application build using R shiny with interactive capability will help users to investigate the various correlations lying between different factors that lead people to commit suicide. Using different combinations, the users can customize the programs to target specific area being it by state, age or gender.
Data Exploration
Gender
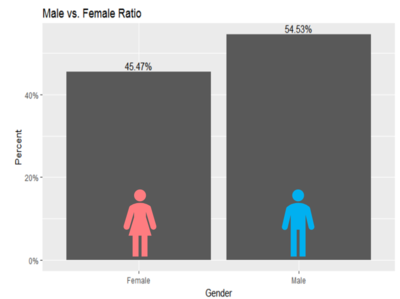
On splitting the entire deaths into Gender, we observed that most of the suicides are committed by men. The suicide rate in men is more because in Indian culture men have to take the responsibility of home along with the work place and due to this dual role their stress level is higher than women. Use the below code to get this plot.
Gender vs State
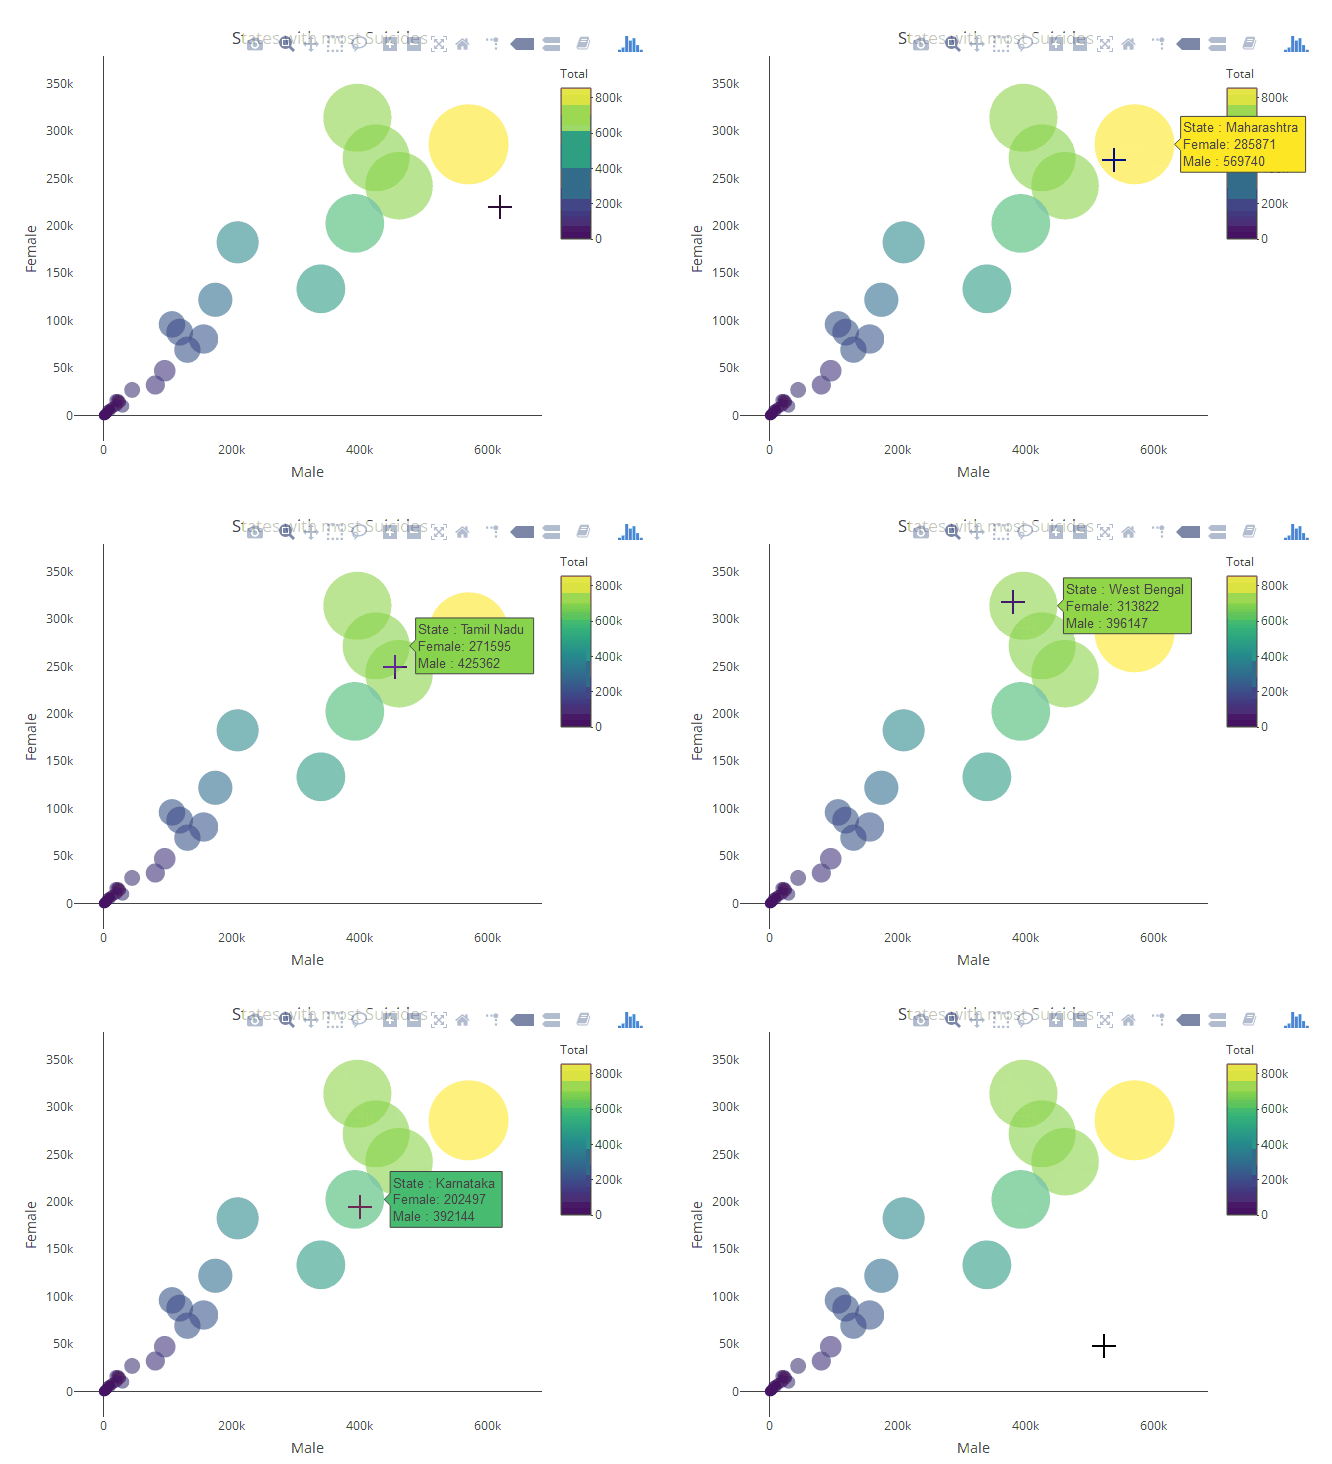
The bubble plot shows that the States Maharashtra, Tamil Nadu, West Bengal, Andra Pradesh, Karnataka and Kerela have the highest death ratio considered to the other states of India. Among these 6 states, 4 of the states - Tamil Nadu, Andra Pradesh, Karnataka and Kerela belong to the Southern region of India. These states are prone to more suicides at the same time the population in these states are more. The percentage of suicidal deaths in these states totals upto 64.3 % out of all the states. Use the below code to get this plot.
| State | Percentage of suicidal deaths |
|---|---|
| Maharashtra | 12.4 % |
| West Bengal | 11.7 % |
| Tamil Nadu | 11.3 % |
| Andra Pradesh | 11.2 % |
| Karnataka | 10.1 % |
| Kerela | 7.4 % |
Age
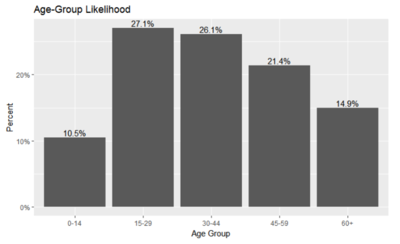
From the Age-Group Likelihood chart above, we can see that the highest percentage, 27.1 %, of people committing suicide are at the age group of 15-29. The youngsters, from the time when the data was collected, were not able to accept the failures in various stages of their life and pressure to get good score from parents and the school makes it worse ultimately leading them to get depressed and lose hope and finally commit suicide.
When we further look into the data, the state Maharashtra has about 13.4% deaths in this age group with about 41% of death caused by Family Problems for Maharashtra. If we take all the states, it was observed that the deaths caused by Family problems was the highest about 23.8%.It was also observed that the death caused by family problems were increasing year on year. The highest deaths were on the year 2011 with about 9.7% deaths. Use the below code to get this plot.
Causes
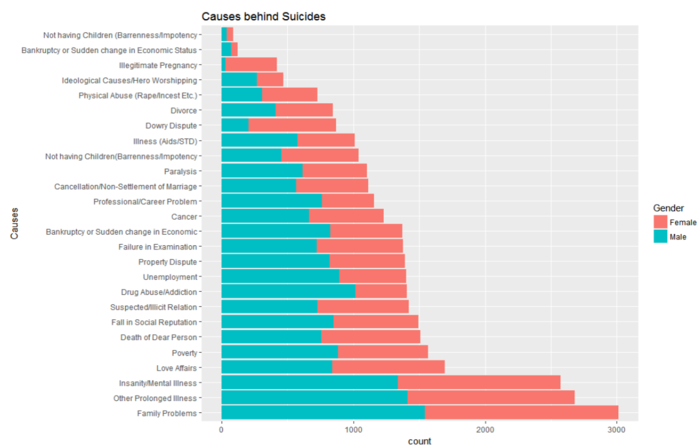
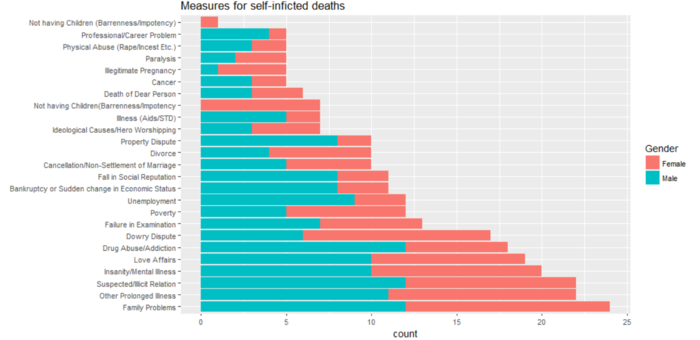
Family problems seemed to be the top most reason for both men and women to commit suicide across all years. Particularly, Men are observed to be in a high proportionate. Considering the practice in India where men are the bread earner in most of the families, it makes sense why the proportionate is more in Men. But this has been changed in the recent years. At the same time, many deaths can be observed due to illnesses with about equal proportionate in both gender. In many parts of India, the hospital facility is not well established, also due to a poor social status many people cannot get treated in hospitals for a long time.
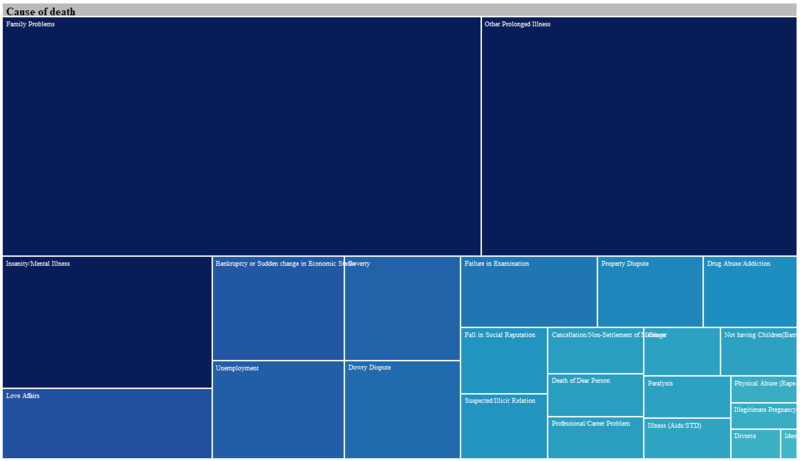
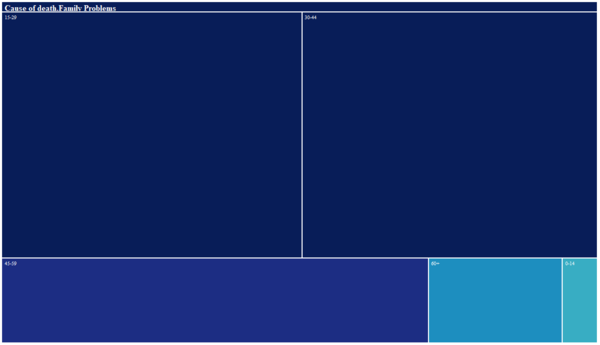
Figure 1 shows the plot for causes for a particular year, and figure 2 is a one step drill down of Figure 1. By clicking on family problems, we can see that the age from 15 - 29 and 30 - 44 are more prone to commit suicide because of family problems. Use the below code to get Tree map.
Analysis
Temporal
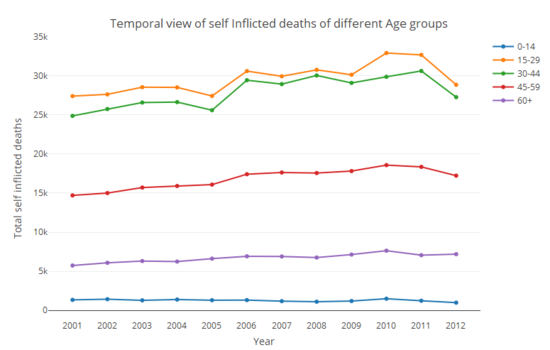
The line chart shows us that the age group 15-29 and 30-44 are prone to commit suicide more comapred to other age groups. On further exploration, it was observed that poplulation under age group '15-29' commited suicide caused by Failure in Examination and Family problems. For the age group '30-44' commited suicide because of Family problems, Prolonged Illness and Suspect / Illicit Relations. Use the below code to get this plot.
For age group '15-29' and '30-44'
Spatial
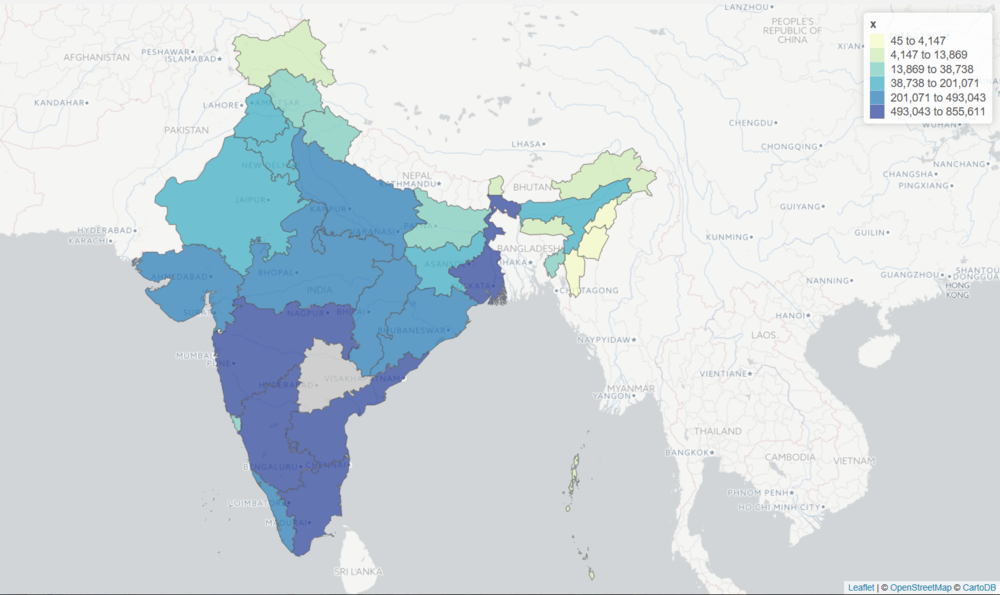
The suicide rate is more in Southern and Western states of India. The highest being Maharashtra, belonging to the Western Region, with 12.5% self inflicted deaths. The second highest state is Tamil Nadu, from southern Region, with 11.4%.
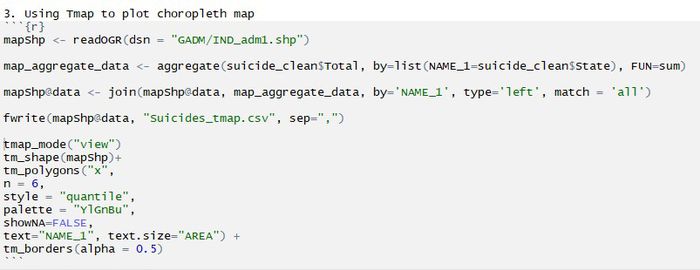
It can also be seen that West Bengal from the Eastern region is particularly high compared to the other eastern regions with self inflicted deaths of about 11.2 %. For Tamil Nadu, the education qualification of people who committed suicide were more of Middle School level or No education. When considering the Professional Profile, about 27 % were House wives. Use the below code to get the choropleth map.
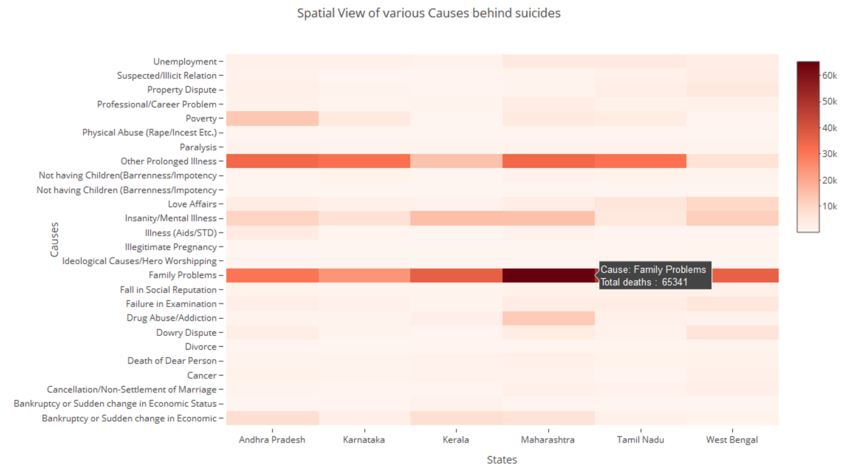
On plotting the causes for the 6 states with the highest suicidal death rates, we can see Family problem is the top cause for suicide. Use teh below code to get the heat map.
