Lw-preparation
Presented by: HUANG Liwei (liwei.huang.2016@mitb.smu.edu.sg)
Visualization tool: Tableau
Data Preparations
Modifications on Source Table
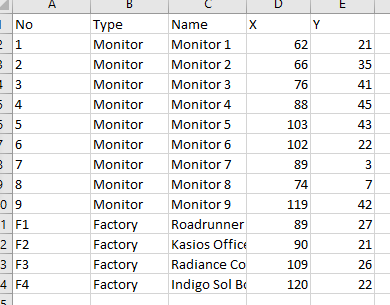
- Create an excel file for recording coordinates of monitors/factories.
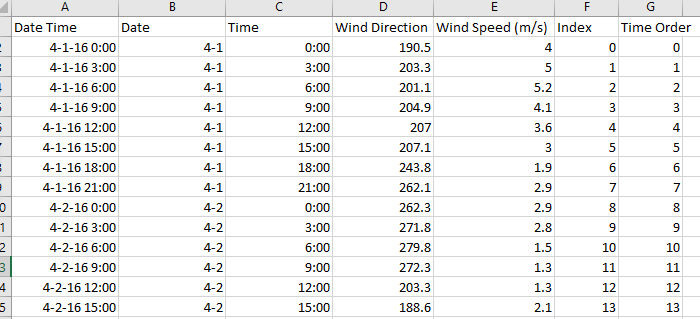
- Modify "Meteorological Data.xlsx", create two new columns for order index, 'index' is for overall order, 'time order' is for representing the order of each month.
- Create another sheet in "Meteorological Data.xlsx", calculate the x-y coordinates based on wind directions & speed.
The formular of x coordinates is:
WindSpeed*SIN(RADIANS(WindDirection))*(-1)+'TimeOrder
The formular of y coordinates is:
WindSpeed*COS(RADIANS(WindDirection))*(-1)
Append a set of same-length values representing the original points of x-y coordinates. x is as same as the 'time order', y is 0.
Trellis Graph
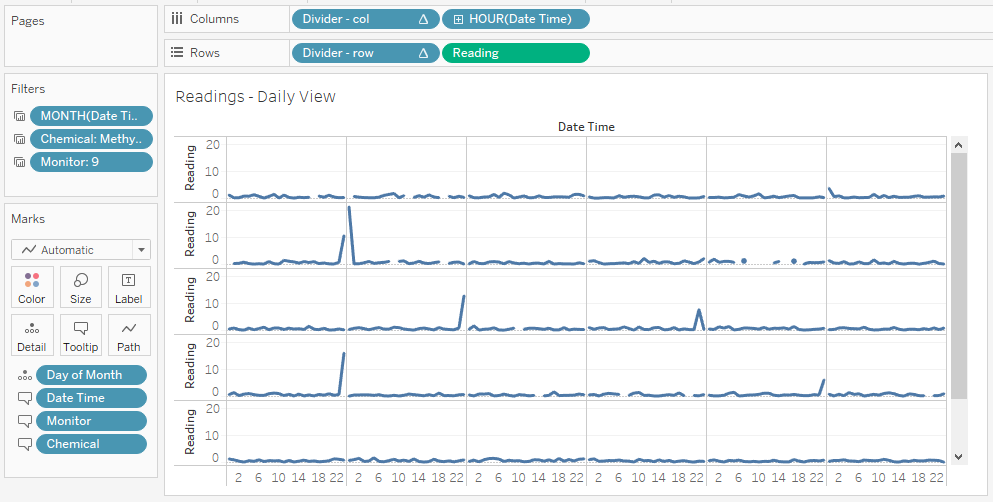
- Create new calculated fields as row & column divider.
The formular of row divider: int((index()-1)/(round(sqrt(size())))) The formular of column divider: (index()-1)%(round(sqrt(size())))
- Set filters.
Set month, chemical, monitor as filters with single value.

- Plot graph.
Set hour (discrete) as columns, readings as rows with unaggreagated measures.
Put column divider and row divider into columns and rows respectively, both calculating using day of the month.
Put day of the month as detail. Set marks as line.
Supply the information tooltips with related attributes.


