Lw-preparation
Revision as of 23:49, 16 July 2017 by Liwei.huang.2016 (talk | contribs)
 |
VAST Challenge 2017 - Mini Challenge 2 |
Presented by: HUANG Liwei (liwei.huang.2016@mitb.smu.edu.sg)
Visualization tool: Tableau
Data Preparation
Modifications on Source Table
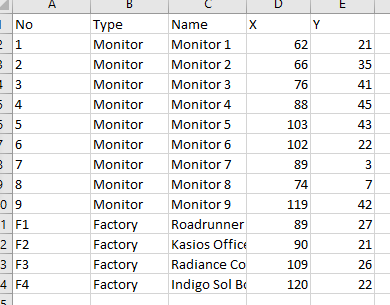
- Create an excel file for recording coordinates of monitors/factories.

- Modify "Meteorological Data.xlsx", create two new columns for order index, 'index' is for overall order, 'time order' is for representing the order of each month.
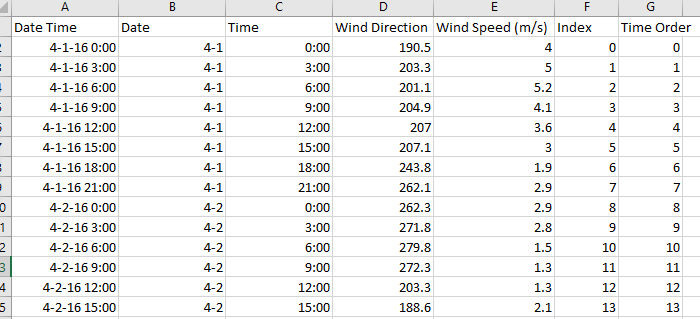

- Create another sheet in "Meteorological Data.xlsx", calculate the x-y coordinates based on wind directions & speed.
The formular of x coordinates is:
WindSpeed*SIN(RADIANS(WindDirection))*(-1)+'TimeOrder
The formular of y coordinates is:
WindSpeed*COS(RADIANS(WindDirection))*(-1)
Append a set of same-length values representing the original points of x-y coordinates. x is as same as the 'time order', y is 0.