ISSS608 2016-17 T3 Assign AKANKSHA MITTAL - Dashboard
Revision as of 20:48, 6 July 2017 by Akanksham.2016 (talk | contribs)
|
|
|
|
Data Exploration
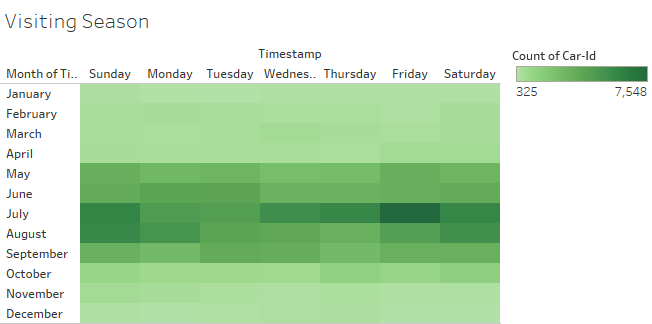
While exploring data, I found that the general visiting peak time is from May to September, out of which July was the most crowded.

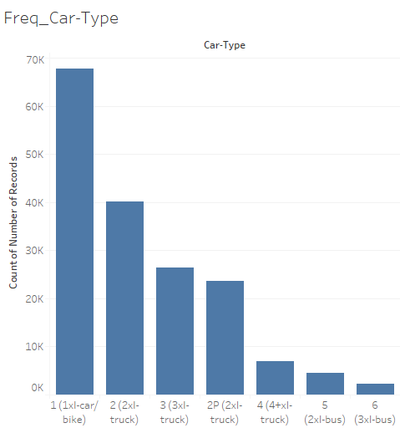
The car-type 1 is the most common vehicle that is part of preserve traffic.

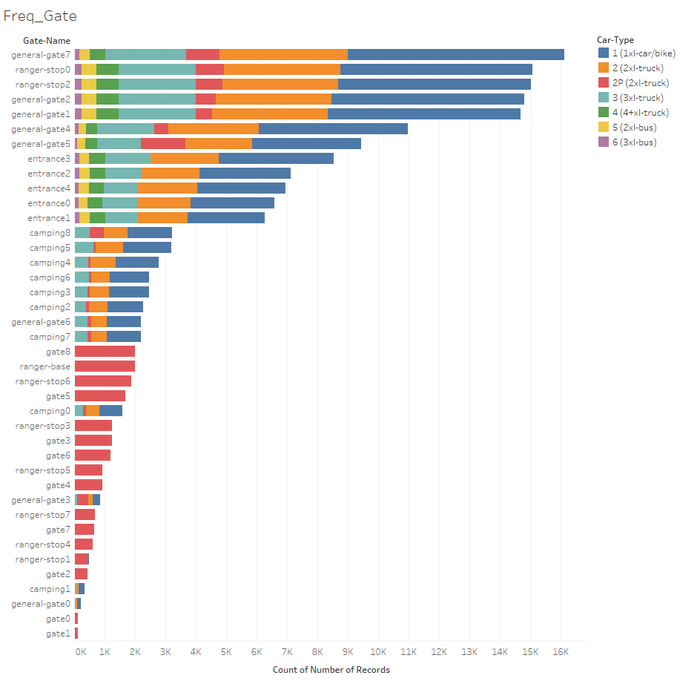
Frequency of vehicles passing through different gates.

From this graph I found suspicious that there are few cars/bikes (car-type 1) present in the ranger-stop 1 which is protected by gate 2 but not captured by the sensor at gate 2 which we will discuss later on this page. Otherwise all others seems alright.
