ISSS608 2016-17 T3 Assign AKANKSHA MITTAL - Data Preparation
|
|
|
|
Contents
About Dataset
The data of 397 days is provided with total 171477 data points and 18702 unique vehicle IDs.
There are sensors present on various parts of preserve capturing the movement of traffic. Few of them are present at five types of gates. These are present in dataset as [Gate-name]:
| Gate-name | Description |
|---|---|
| Entrances (0-4) | All vehicles pass through an Entrance when entering or leaving the Preserve. |
| General-gates (0-7) | All vehicles may pass through these gates. These sensors provide valuable information for the Preserve Rangers trying to understand the flow of traffic through the Preserve. |
| Gates (0-8) | These are gates that prevent general traffic from passing. Preserve Ranger vehicles have tags that allow them to pass through these gates to inspect or perform work on the roadway beyond. |
| Ranger-stops (0-7) | These sensors represent working areas for the Rangers, so you will often see a Ranger-stop sensor at the end of a road managed by a Gate. Some Ranger-stops are in other locations however, so these sensors record all traffic passing by. |
| Camping (0-8) | These sensors record visitors to the Preserve camping areas. Visitors pass by these entering and exiting a campground. |
There are six categories of vehicles. These are present in dataset as [Car-type]:
| Car-type | Description |
|---|---|
| 1 | 2 axle car (or motorcycle) |
| 2 | 2 axle truck |
| 3 | 3 axle truck |
| 4 | 4 axle (and above) truck |
| 5 | 2 axle bus |
| 6 | 3 axle bus |
Vehicles receiving a pass with a “P” appended to their category are park service vehicles that have access to all parts of the Preserve. Currently, the Preserve vehicles are only 2 axle trucks, so they are designated as “2P” vehicle type.
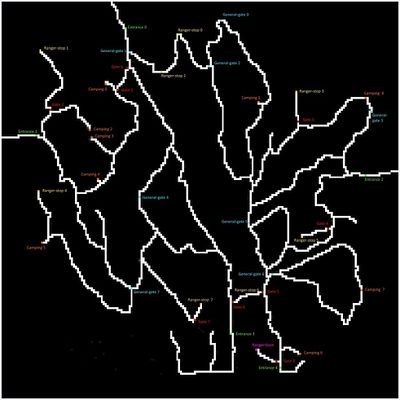
The Preserve Map
The contractors working with the Nature Preserve rangers have provided a map that presents the Preserve in terms of a 200x200 gridded area. The grid is oriented with north at the top of the map. Grid location (0,0) is at the lower left corner of the map (the SW corner). They have superimposed both the roadways and the sensor locations on this grid. The map shows an area 12 miles x 12 miles.
Roadways are indicated by white colored pixels on the map. Each sensor type has its own unique color: Entrances (green), General-gates (blue), Gates (red), Ranger-stops (yellow) and Camping (orange).
Other information about the dataset:
- Traffic either passes through the Preserve, stay as day campers, or stay as extended campers.
- Preserve Rangers stay at the ranger-base toward the southeast of the Preserve when they are not working in the Preserve.
- The speed limit through the Preserve is 25 mph.
- The Preserve area does not observe “Daylight Savings Time”.
- The roadways traveling southward from Entrances 3 and 4 do continue to other roadways outside of the Preserve area, but these are not shown on the map. VeExhicle data will not reflect travel beyond the Preserve in this direction.
Data Snippet (.csv format)
| Timestamp | car-id | car-type | gate-name |
|---|---|---|---|
| 2015-05-01 00:15:13 | 20151501121513-39 | 2 | entrance4 |
| 2015-05-01 00:32:47 | 20151501121513-39 | 2 | entrance2 |
| 2015-05-01 01:12:42 | 20151201011242-330 | 5 | entrance0 |
| 2015-05-01 01:14:22 | 20151201011242-330 | 5 | general-gate1 |
| 2015-05-01 01:17:13 | 20151201011242-330 | 5 | ranger-stop2 |
| 2015-05-01 01:20:36 | 20151201011242-330 | 5 | ranger-stop0 |
| 2015-05-01 01:24:11 | 20151201011242-330 | 5 | general-gate2 |
| 2015-05-01 01:46:16 | 20151201011242-330 | 5 | entrance2 |
| 2015-05-01 01:55:25 | 20155501015525-264 | 1 | entrance0 |
| 2015-05-01 01:56:53 | 20155501015525-264 | 1 | general-gate1 |
Data Preparation
The dataset given is clean with no missing values. But to undergo further investigation, I need to create few new variables that will help me to finding the missing pieces of the jigsaw puzzle. The new variables created are:
- X1 – This will give me X coordinates of all the gates present in the map.
- Y1 – This will give me Y coordinates of all the gates present in the map.
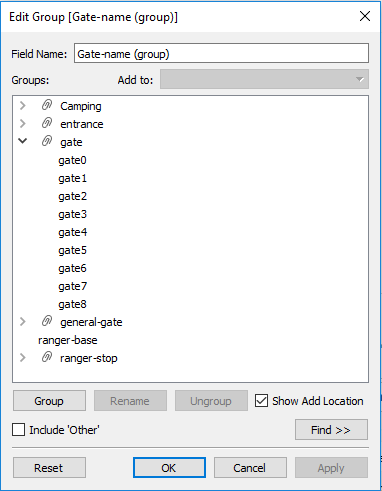
- Gate-name (group) – This groups the gates by their types as Camping, entrance, general gates etc.
Get map as background image
- Create a new excel sheet with 3 columns Gate-name, X1 and Y1.
- Copy all the gate-name and paste it in this new worksheet.
- Mark the topmost gate on the columns as X1 = 982, Y1 = 982
- Save this worksheet as Coords.csv
- Connect tableau with the data files.
- Launch Tableau
- Connect -> To a File -> Text File.
- Browse the file “Lekagul Sensor data.csv” and “Coords.csv”
- Go to Data Source tab and create union as:
Now go to sheets for further steps.
- Bringing the map as background image in tableau.
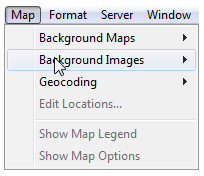
Select Map > Background Images and then select a data source.
In the Background Images dialog box, click Add Image.
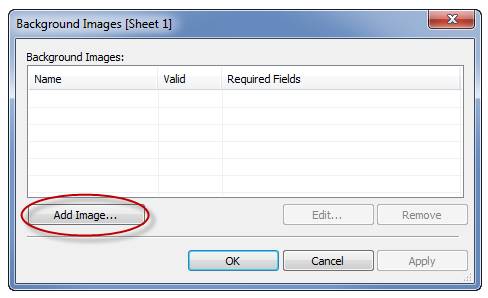
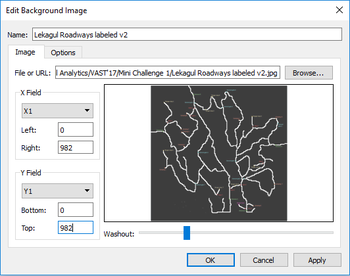
In the Add Background Image dialog box do the following:
- Type a name for the image into the Name text box or click Browse to navigate to and select the image you want to add to the background.
- Select the field to map to the x-axis of the image and specify the left and right values.
- Select the field to map to the y-axis of the image and specify the top and bottom values.
- You can adjust the intensity of the image using the Washout slider. The farther the slider moves to the right, the more faded the image will appear behind your data.
Select the options as shown and click OK.
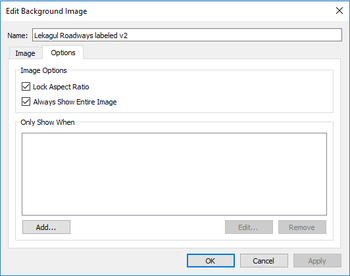
- Build a view with a background image
After adding a background image, build the view in a way that matches the x and y mappings that are specified for the image. That is, the fields specified as x and y must be on the proper shelves. Follow the steps below to set up the view correctly:
- Place the field mapped to the x-axis on the Columns shelf.
- Place the field mapped to the y-axis on the Rows shelf.
- By default it comes as Sum(X1) and Sum(Y1), convert both into dimensions by clicking in the triangle beside this text on Row and Column shelf.
The image will appear on the work area.
Get X1 and Y1 coordinates for all Gate-names
1. Zoom the image and right click on the gate mark pixel -> Annotate -> Point
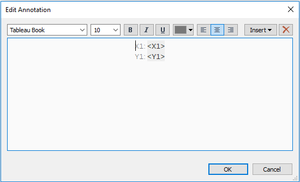
2. The “Edit Annotation” dialog box will appear. Click OK
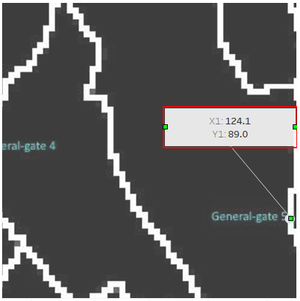
3. Copy these values and paste it to the X1 and Y1 column in Coords.csv file.
4. Repeat the same process for all the Gate-name.
5. Refresh the data source (Tableau).
Create new field in tableau
Gate-name (group)
- In Data Source tab, right click the Gate-name field -> Create Group
- Camping 0-8 as Camping
- Entrance 0-4 as Entrance
- Gate 0-8 as Gate
- General-gate 0-7 as General Gate
- Ranger-stop 0-7 as Ranger-stop
That’s it !!! We are ready to go !!!

