From Visual Analytics and Applications
Jump to navigation
Jump to search
ISSS608 Visual Analytics and Applications Project
Team S-MALL: Chen Yun-Chen | Chiam Zhan Peng | Zheng Bijun
Motivation
Brick and Mortar retail malls are facing stiff challenge from online e-commerce shopping and mobile smartphone penetration. How can physical malls continue to survive under such conditions? Also, how can shopping malls transform as part of the Smart Nation initiative in Singapore? Using real data of a mega-mall, this project aims to leverage multiple data sources from typical retail operation, and develop a visual application to assist company reveal customer behavior, uncover patterns that may present opportunities for the mall as well as tenants to better optimise operations, layout, events, maximize sales as well improve the customers' experience.
Data Description
Profile Data: contains demographic information of the shopping mall members
Transaction Data: contains two months transnational records from January to February 2017
Wi-Fi Sensor Data: contains two months Wi-Fi sensor records captured in the mall, which can be used to analyze the movement of customers
Maps: shopping mall layouts
Expected Outcome
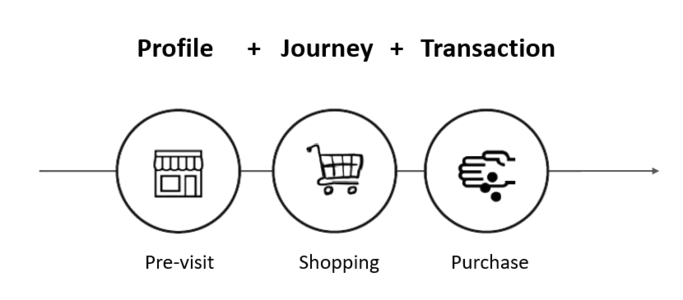
Data Integration: Combine the three dataset to derive patterns, associations and actionable insights
Interactive Visualization:
- Overview of customers movements patterns by weeks, days, hours
- Inter-floor movement
- Customers' profile and transactions integration
Use Cases: Zone Traffic Statistics, Zone Traffic Flow, Staff Planning, Marketing/Event Campaign
Visualization Tool & Packages
R: Hexagonal binning using ggplot2 and Kernel Decimal Estimate using stat_Density2d
R: Chord diagram using chorddiag
R: Shinyapp, shinydashboard, flexdashboard
Part3:
| Visualization
|
Methodology & Technique
|
Usage
|
| insert image of line chart
|
- Chart type: Line chart & trellis plot
- R Package: ggplot2, plotly
- Interactivity: Use selectInput to control plot and segment by different timelevels, eg. Date, day of week, and hour
|
- Line chart without trellis (segment=None) can be used to analyze the daily/weekly/hourly pattern of footfalls.
- Trellis plot can be used to detect the cycling pattern over time.
|
| insert image of chord diagram
|
- Chart type: Chord diagram
- R Package: chorddiag
- Interactivity: Set specific datetime using selectIput and sliderInput to view the traffic transfer across floors.
Hover to each floor to see the destination of its outflow traffics.
|
- Analyze traffic flow across floor for specific datetime selection
|
| insert image of hexbin map
|
- Chart type: Hexagonal binning map
- R Package: hexbin, ggplot, plotly
- Key parameter setting: number of bins is set to 50
- Interactivity: Set specific datetime using selectIput and sliderInput to view the traffic density on each floor.
Click on specific hexbin to investigate members identity.
|
- Analyze traffic density of floors for specific datetime selection
- Drill down to shoppers’ identity based on interested density area
|

