ISSS608 2016-17 T3 Assign SANGHAVY BALAMOUROUGANE
|
|
|
Contents
Challenge Background
Mistford is a mid-size city is located to the southwest of a large nature preserve. The city has a small industrial area with four light-manufacturing endeavors. Mitch Vogel is a post-doc student studying ornithology at Mistford College and has been discovering signs that the number of nesting pairs of the Rose-Crested Blue Pipit, a popular local bird due to its attractive plumage and pleasant songs, is decreasing! The decrease is sufficiently significant that the Pangera Ornithology Conservation Society is sponsoring Mitch to undertake additional studies to identify the possible reasons. Mitch is gaining access to several datasets that may help him in his work, and he has asked you (and your colleagues) as experts in visual analytics to help him analyze these datasets.
Mini-Challenge 1 - Overview
The Boonsong Lekagul Nature Preserve is used by local residents and tourists for day-trips, overnight camping or sometimes just passing through to access main thoroughfares on the opposite sides of the preserve. The entrance booths of the preserve are monitored in order to generate revenue as well as monitor usage. Vehicles entering and exiting the preserve must pay a fee based on their number of axles (personal auto, recreational trailer, semi-trailer, etc.). This generates a data stream with entry/exit timestamps and vehicle type. There are also other locations in the part that register traffic passing through. While hiking through the various parts of the preserve, Mitch has noticed some odd behaviors of vehicles that he doesn’t think are consistent with the kinds of park visitors he would expect. If there were some way that Mitch could analyze the behaviors of vehicles through the park over time, this may assist him in his investigations.
As part of his investigation, ornithology student Mitch Vogel needs to examine the movement of traffic through the Boonsong Lekagul Nature Preserve. His first working hypothesis is that there is some link between the traffic going through the preserve and the decline in the nesting Rose-crested Blue Pipit—maybe the traffic noises are drowning out mating calls! Or perhaps he can discover some odd goings on in the traffic patterns—perhaps campers are invading the bird’s habitat areas?
There are park rangers working as caretakers of the nature preserve, and they have been collecting traffic data for their annual reporting to the local government. They have provided Mitch with some data, explanations about the data, and a map. Mitch feels unprepared to analyze this information alone and is asking you to help with your visual analytics prowess.
Use visual analytics to analyze the available data and develop responses to the questions below. In addition, prepare a video that shows how you used visual analytics to solve this challenge. Novel visualizations and analysis approaches are especially interesting for this mini-challenge. Please do not use any other data in your work (including other Internet-based sources or other mini-challenge data).
Please visit VAST Challenge 2017: Mini-Challenge 1 for more information and to download the data.
Questions to be answered
1. “Patterns of Life” analyses depend on recognizing repeating patterns of activities by individuals or groups. Describe up to six daily patterns of life by vehicles traveling through and within the park. Characterize the patterns by describing the kinds of vehicles participating, their spatial activities (where do they go?), their temporal activities (when does the pattern happen?), and provide a hypothesis of what the pattern represents (for example, if I drove to a coffee house every morning, but did not stay for long, you might hypothesize I’m getting coffee “to-go”). Please limit your answer to six images and 500 words.
2. Patterns of Life analyses may also depend on understanding what patterns appear over longer periods of time (in this case, over multiple days). Describe up to six patterns of life that occur over multiple days (including across the entire data set) by vehicles traveling through and within the park. Characterize the patterns by describing the kinds of vehicles participating, their spatial activities (where do they go?), their temporal activities (when does the pattern happen?), and provide a hypothesis of what the pattern represents (for example, many vehicles showing up at the same location each Saturday at the same time may suggest some activity occurring there each Saturday). Please limit your answer to six images and 500 words.
3. Unusual patterns may be patterns of activity that changes from an established pattern, or are just difficult to explain from what you know of a situation. Describe up to six unusual patterns (either single day or multiple days) and highlight why you find them unusual. Please limit your answer to six images and 500 words.
4. What are the top 3 patterns you discovered that you suspect could be most impactful to bird life in the nature preserve? (Provide a short text answer.)
Traffic Patterns of Life through the Boonsong Lekagul Nature Preserve
"Patterns of Daily Life"
The 'Patterns of Daily Life' analyses identifying the repeating patterns by individuals or groups on a daily basis.
Gate types based on Activity
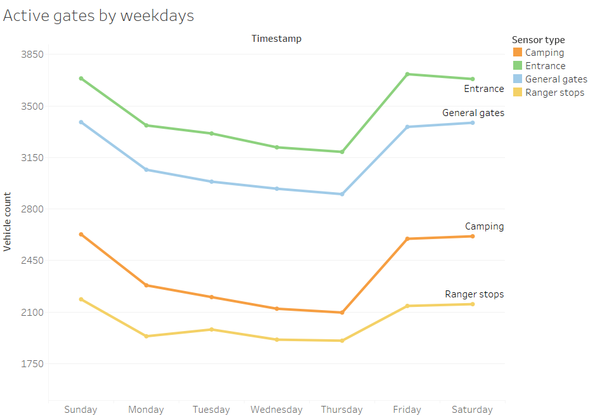
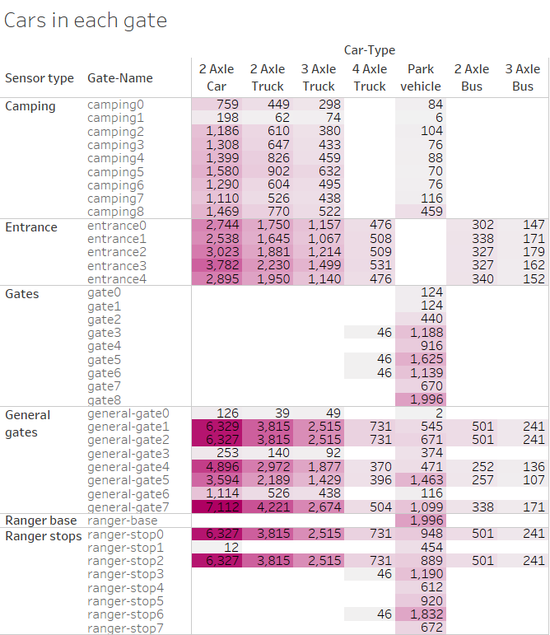
- The most active gates can be seen in the below picture
- All these gates show the least activity for Thursdays and most activity on Sundays for:
1) General gates 2) Camping 3) Ranger stops
- But the most activity for 'Entrances' is on Fridays
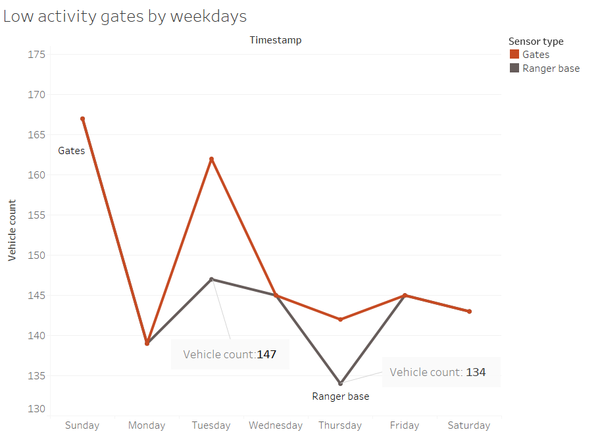
- While 'Ranger base' and 'Gates' are the ones with lowest activity among the gate types and these 2 gates have similar vehicle count almost on all weekdays.
- Except on Tuesdays and Thursdays there is a dip in the number of vehicle going to the Ranger base
Vehicle Activities
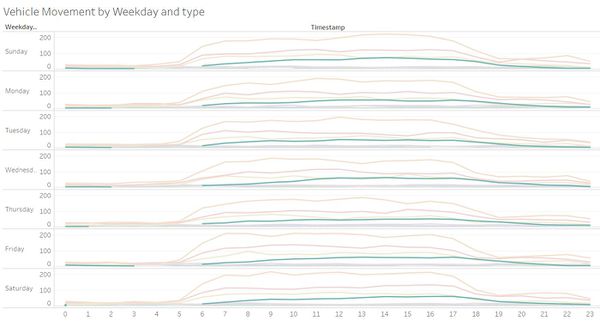
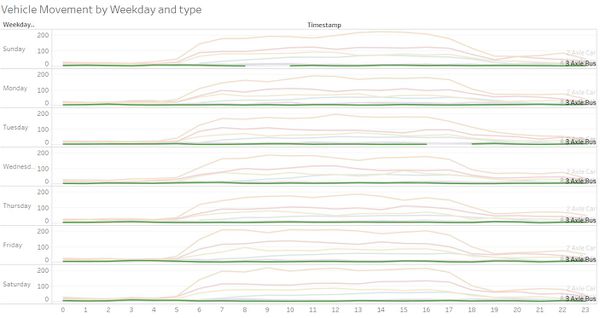
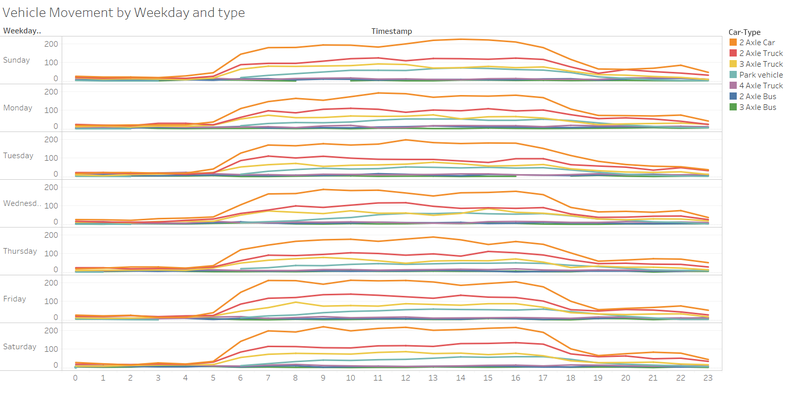
The park vehicles have specific operation timings for different days of the week. The non – operation timings are: * Monday, Tuesday, Wednesday – 2-6 am * Thursday, Friday, Sunday – 3-6 am * Saturday – 1-6 am
The 3 Axle bus does not operate on particular timings on 2 days: * Sundays : 8 - 10 AM * Tuesdays : 4 - 6 PM
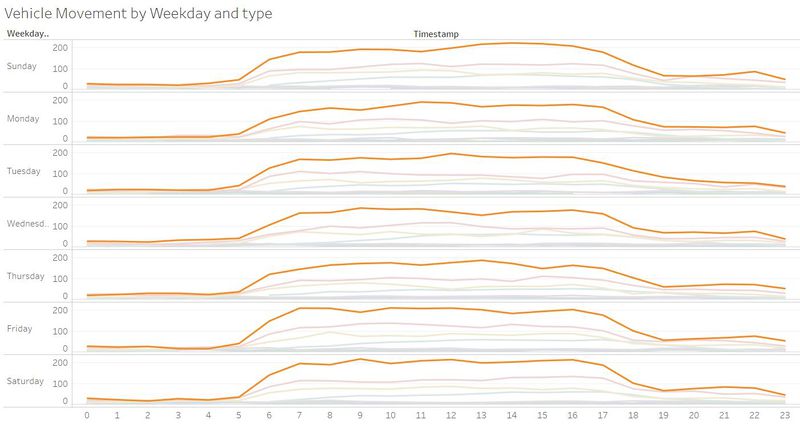
2 Axle cars or motorcycles is the most frequent to the park followed by 2 Axle trucks and 3 Axle trucks and Park vehicles and the less frequent vehicles would be the 2 Axle and 3 Axle buses and 4 Axle trucks.
Peak Hours
- The park is mainly active from 6AM until 5PM on all days. It is mainly active for the vehicles: 2 Axle cars or motorcycles, 2 Axle and 3 Axle trucks. Though Park vehicle's activity starts from 6AM, it is most active only from 11AM till 5PM.
- Though the number of 2 Axle cars or motorcycles decreases by 7PM, there is sudden rise at 10PM decreasing to the lowest by midnight
"Patterns of Long period"
The 'Patterns of Long period' analyses depend on recognizing repeating patterns of activities by individuals or groups over a longer period (multiple days).
Active Gates - High and low
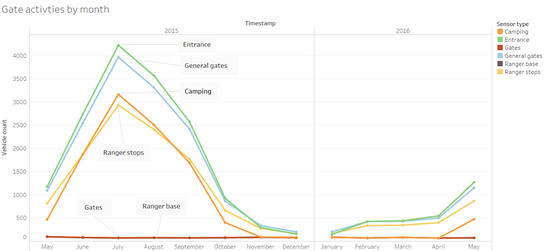
1) The park is highly active in the months from June to September having vehicle counts ranging from 1700 to around 4000 vehicles in the gates and less active from October through May. The gates that are most active in June to September are: * Entrances * General gate * Camping * Ranger stops
The park activity is highest in the month of July and the gates with the maximum activity (that is vehicle count):
While activities in Gates and Ranger base for all months are almost close to each other and has the lowest activity of all gates having vehicle count ranging from 60 to 100.
"Unusual Patterns"
Analysis to find out patterns that differs from the ones that are already observed or anomalies.
Unusual patterns at gates
- 4 axle truck visited the ranger-stop3 and ranger-stop6 at the same time 23 times via gate3 and gate5 and gate6 respectively
- The ranger-stop1 was accessed six times by 2 Axle cars (or motorcycles) on the whole but these vehicles were not recorded at Gate2, which is the only way to get to ranger-stop1.
- General-gate0 was accessed twice by Park vehicles. Could be for any special VIP passes
- 2 axle cars have 2 extra timestamps at general-gate 6 after camping at camping7
- 1 park vehicle went back to ranger-stop7 without using gate7 or it could have went back due to some reasons
4 Axle truck at Gates
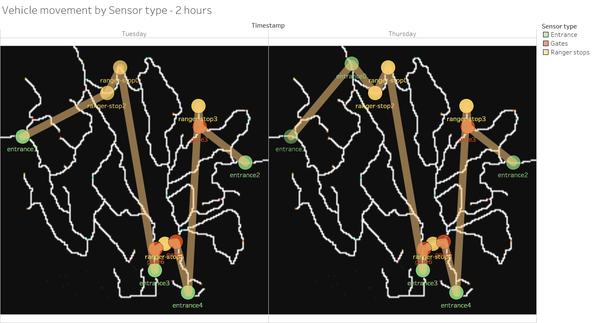
- The 4 axle trucks enter the 'Gates': gate3 - gate5 - gate6 on Tuesdays and Thursdays.
- This truck could enter these gates in order to make a stop or deliver something at Ranger stops '0, 2, 3 and 6'
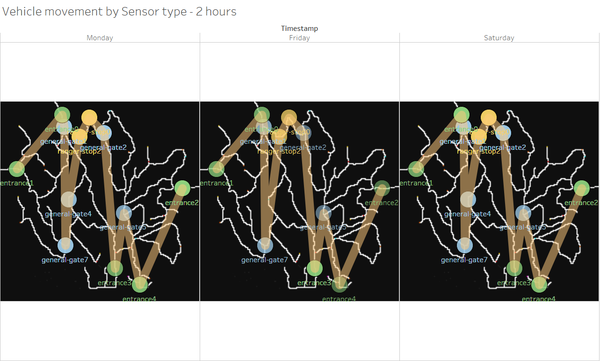
- On other days like Monday, Friday and Saturday, the truck follows the same route as in the image. Except for Sundays, it does not pass through the General gate5. Maybe it is closed on Sundays.
- On all days except Wednesday the truck is active at Ranger stops at any time of day, but on Wednesday, the truck does not move through Ranger stops for from 1AM - 3AM
Visualisation Software
- Tableau

