ISSS608 2016-17 T3 Anuthama Patterns of Life
|
|
|
|
|
|
Patterns of Life over Time
Upon understanding a few of the daily patterns it is not a good idea to look at the patterns over longer period. Lets begin by understanding the time spent at the different areas at the preserve.
Pattern 1
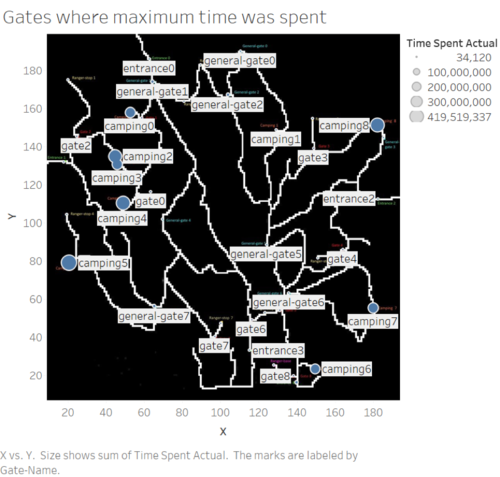
- In general Camping sites are the places where people spent most of their time
- Among camps – camping site 5 >4>8> are more popular. This is not a surprise, the surprising thing is that the time spent at camp 1 is drastically less in comparison to certain entrances and general gates [ like entrance 4 and general gate 7 and 2]
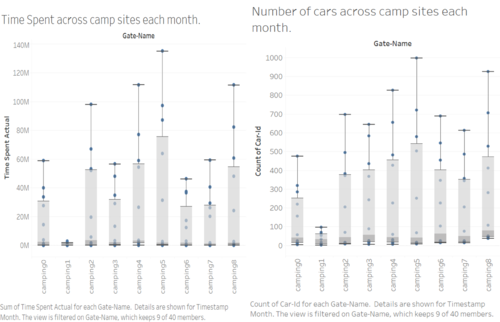
We are curious to know if this pattern is observed across all months or seen only for certain months. Each point on the box plot refers to a month. The box plot on the left confirms that people spent the least amount of time at camp site 1 across all months in comparison to other camp sites. On the other hand we want to investigate if this is due to an overall decrease in cars at camp site 1. The box plot on the right shows that much fewer people chose to camp at camp site 1.
Pattern 2
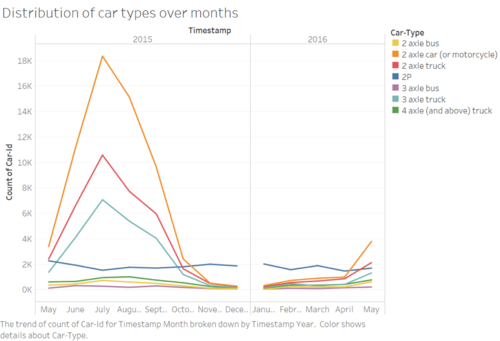
There is a steep decline in overall vehicle count from November onward through March. This period coincides with winter and it is possible that the park is not preferred during this period.
Pattern 3
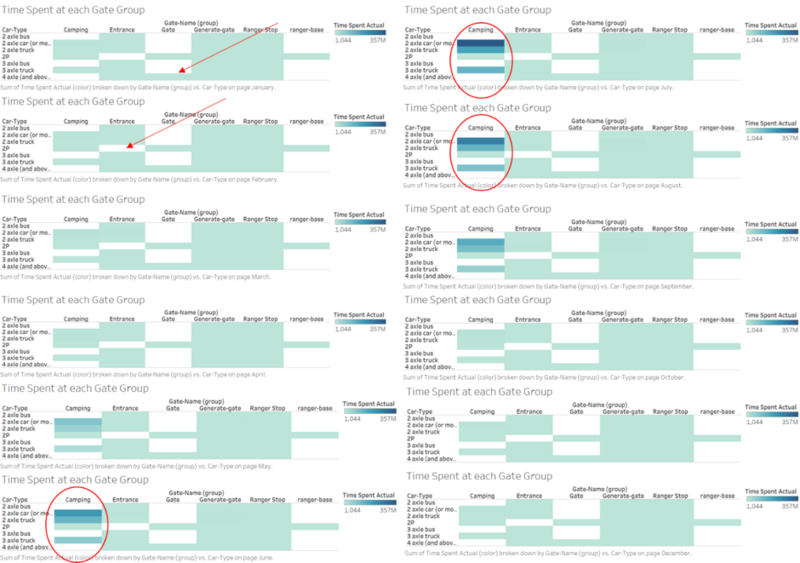
The ranger base was accessed by only 2P vehicles.Surprisingly, 2P vehicles have not crossed any entrance at all. [ This is strange, do they have another entry/exit ?] . How are they assigned thee car ids if they do not pass through the entrance ?
Pattern 4
June, July and August is when the camps are popular, with 2 axle car spending the most time at camp sites followed by 2 axle truck The first arrow confirms the trespassing at Gates by type 4 vehicles which we noticed previously.This pattern in seen across all months except April. In Q1 we detected this trespassing at Gates and now we find more information about this trespassing. It does not look like a one time event. If the trespassing is happening so frequently it must have been carefully planned. Something that is equally surprising is how such a repeated pattern was not identified by Park Rangers.
Pattern 5
2P Ranger vehicles count have almost doubled in May. Why is this happening in May, as per the previous pattern June through August are peak period of footfall at preserve. The count on Fridays is the highest reaching 800.
Pattern 6
We noticed that some vehicles came to the park multiple times. Here we have the frequent flyers of the park.
20154519024544-322 --- 16 Trips
20154112014114-381 --- 7 Trips
20162904122951-717 --- 6 Trips
20153712013720-181 --- 4 Trips
20162027042012-940 --- 3 Trips
20150204100226-134 --- 2 Trips
20150322080300-861 --- 2 Trips
20153427103455-30 --- 2 Trips
20154501084537-684 --- 2 Trips
20160623090611-424 --- 2 Trips
20161008061012-639 --- 2 Trips


