Difference between revisions of "ISSS608 2016 17T3 Group12 Report"
Jump to navigation
Jump to search
| Line 106: | Line 106: | ||
=References= | =References= | ||
| − | + | ||
| + | https://wiki.smu.edu.sg/17t2is415g1/IS415_Team_Ninja_Project | ||
| + | |||
| + | https://cran.r-project.org/doc/contrib/intro-spatial-rl.pdf | ||
| + | |||
| + | http://rpubs.com/nabilabd/118172 | ||
| + | |||
| + | http://data-analytics.net/cep/Schedule_files/geospatial.html | ||
Revision as of 02:03, 7 August 2017
|
|
|
|
|
Application
The RainyApp can be accessed through:
insert link here.
Methodology
User Guide
Packages Used
- dplyr
- shiny
- ggplot2
- tidyverse
- ggmap
- sp
- plotly
- shinydashboard
- rgdal
- gstat
- gridExtra
- rvest
Future Work
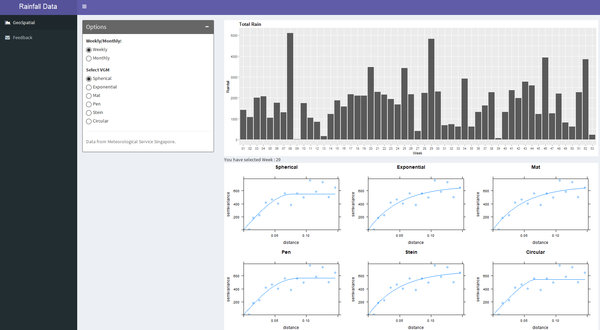
- Currently the group has initially identified 6 variogram distribution, but considering there are 17 vgm implemented in the gstat library a great addition to future works could include comparing the dataset in all 17 vgms and getting the top 5 as options for the users.
- Currently the model is restricted to the Rainfall Data from NEA but future works improvement can include uploading of any dataset where the user just needs to indicate the location of the dataset and the variable to be interpolated and let the application capture the shapefile and map through DIVA-GIS and any open source map to create the interpolation.
References
https://wiki.smu.edu.sg/17t2is415g1/IS415_Team_Ninja_Project
https://cran.r-project.org/doc/contrib/intro-spatial-rl.pdf
http://rpubs.com/nabilabd/118172
http://data-analytics.net/cep/Schedule_files/geospatial.html
