ISSS608 2016 17T3 Group12 Proposal
|
|
|
|
|
Contents
Abstract
Singapore has made great efforts in making government agency data easily accessible to everyone and this project aims to make use of such government data and transforming it to an easily consumable form for the general audience. The group is tapping into the historical rainfall data from the website of the National Environmental Agency of Singapore and using various library available in R to project how rainfall data collected from various weather stations in Singapore can be used to project the rain experienced over a specific time period using Geospatial Analysis. By coming up with an application the team hope it could provide an example on how open source resources can augment the vast government data availability to share meaningful insights to both to public and private organizations.
Project background
As we progress more into the 21st century we find ourselves faced with the issue of Climate Change and how it affects our daily lives, more so how is Singapore affected by it. By now we’ve had our own share of complaints regarding the unpredictable weather and the warm night, but how much has it really change since the turn of the century? This visualisation project aims to show how rainfall differs in various area in Singapore. The idea of the project is to interpolate the rainfall across whole Singapore using some geospatial techniques and visualise the same with the help of RShiny Application.
Challenges
The main challenge for the project is the nature and structure of the data, though all the data required are readily available but it would take some time to get the data if the team would do it manually thus the first problem that needs to be solved by the team is setting up a code that would extract the data from the source website and host it in a server where the final output of the project can access the data at will. Another challenge is to translate the rainfall data into a surface map that would represent the rainfall in the whole of Singapore base on the preliminary collection station.
Data Source
Singapore Historical Rainfall Dataset
http://www.weather.gov.sg/climate-historical-daily
The rainfall data will come from Singapore's National Environment Agency who captures it from multiple weather stations across the country on a monthly basis. NEA's website includes an option of downloading the rainfall data on a per weather station per month on eaither a PDF or a CSV format.
Singapore Shapefile
https://data.gov.sg/dataset/master-plan-2014-planning-area-boundary-no-sea
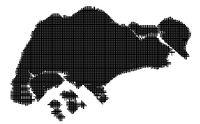
The Singapore Shapefile will be captured from the data.gov.sg which will be used in plotting the grid in line with the geospatial interpolation
References
https://wiki.smu.edu.sg/17t2is415g1/IS415_Team_Ninja_Project
https://cran.r-project.org/doc/contrib/intro-spatial-rl.pdf
http://rpubs.com/nabilabd/118172
http://data-analytics.net/cep/Schedule_files/geospatial.html
