Difference between revisions of "ISSS608 2016 17T3 Group12 Report"
Jump to navigation
Jump to search
| Line 42: | Line 42: | ||
|- | |- | ||
|[[File:Datasource.png|600px]]<br/> | |[[File:Datasource.png|600px]]<br/> | ||
| − | <center>''' | + | <center>'''NEA'''</center> |
| | | | ||
| − | + | National Environment Agency collects data from total 58 weather stations all over Singapore, this data is made available for the public and can be found in their website. Data is provided monthly for each station, and from each station respective rainfall, temperature, wind speed etc are recorded. For this project we are using only rainfall data. Data.gov.sg provided the shape file for the visualisation. | |
| | | | ||
|- | |- | ||
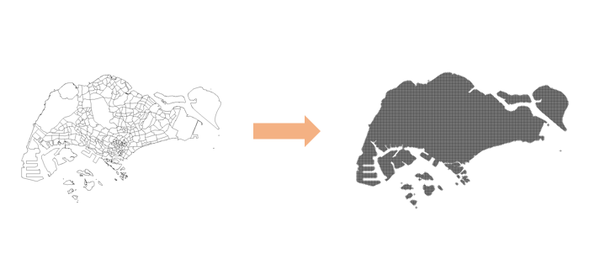
|[[File:Shp-grid.png|600px|centre]] | |[[File:Shp-grid.png|600px|centre]] | ||
| − | <center>''' | + | <center>'''Grid Points''' </center> |
| | | | ||
| − | + | From the shape file, we created grid points for interpolation. Interpolation is the important in this visualisation as rainfall from weather stations don't make much sense as its own. | |
| | | | ||
|- | |- | ||
| Line 56: | Line 56: | ||
<center>'''Roe 3''' </center> | <center>'''Roe 3''' </center> | ||
| | | | ||
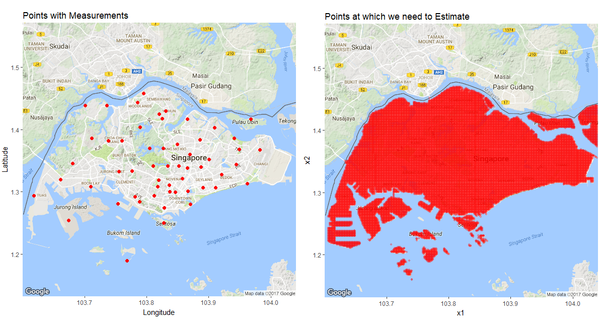
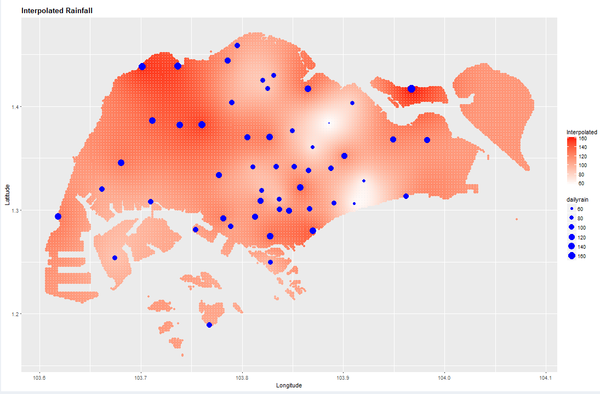
| − | The | + | The first graph shows the 58 weather stations and the second one is the interpolated visualisation of the same. It is evident that the first visualisation is not that useful while considering a certain region or the whole Singapore. |
|- | |- | ||
Revision as of 01:30, 7 August 2017
|
|
|
|
|
Application
The RainyApp can be accessed through:
insert link here.
Methodology
Data Preparation
The data has been downloaded from NEA, which is provided for 58 active weather stations across spread across Singapore. The data is provided for each month and is updated on 10th of every month. This data has been used by us to
Shiny Application
| Description | R Script | Output |
|---|---|---|
| row 1, cell 1 | row 1, cell 2 | row 1, cell 3 |
| row 2, cell 1 | row 2, cell 2 | row 2, cell 3 |
