Difference between revisions of "ISSS608 2016-17 T3 ARUNKUMAR INSIGHTS"
(→Answer) |
|||
| Line 42: | Line 42: | ||
<table width=90%> | <table width=90%> | ||
<tr> | <tr> | ||
| − | <td>[[File: Daily_Pattern_2.jpg| | + | <td>[[File: Daily_Pattern_2.jpg|500 px|left]]</td> |
| + | <td>[[File: Hour.jpg|500 px|left]]</td> | ||
</tr> | </tr> | ||
</table> | </table> | ||
Revision as of 04:27, 17 July 2017
|
|
|
Contents
Preliminary Viz
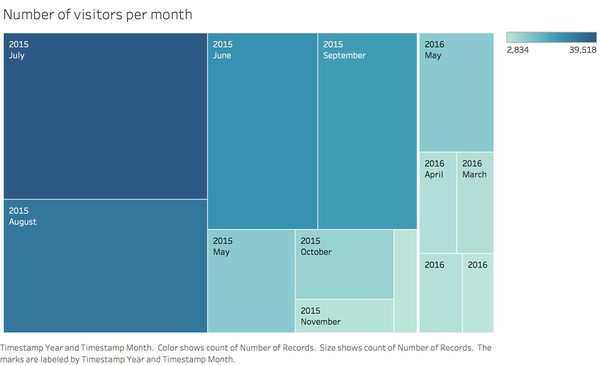
Number of Visitors per month
This visualisation reveals that the most visitors came in July 2015, whereas the adjacent months June, aug and September has almost the same number of visitors.Number of Visitors to camping spots
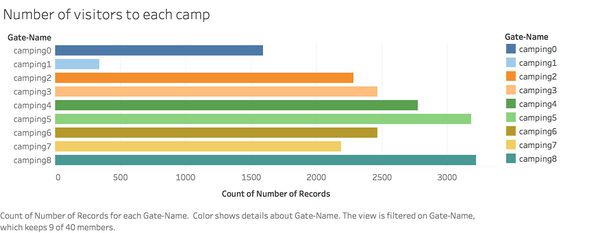
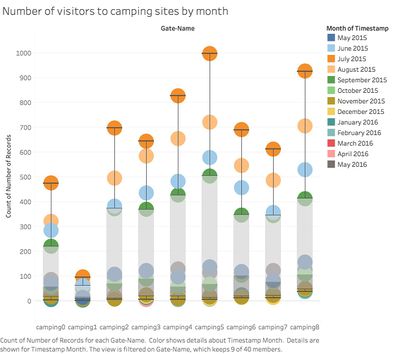
Camp site 8 and 5 are the most preferred whereas the campsite 1 is least preferred by the visitors.Questions
The questions to be answered in this VAST challenge are listed down along with the visualisations and some explanations.
Question 1
“Patterns of Life” analyses depend on recognizing repeating patterns of activities by individuals or groups. Describe up to six daily patterns of life by vehicles traveling through and within the park. Characterize the patterns by describing the kinds of vehicles participating, their spatial activities (where do they go?), their temporal activities (when does the pattern happen?), and provide a hypothesis of what the pattern represents (for example, if I drove to a coffee house every morning, but did not stay for long, you might hypothesize I’m getting coffee “to-go”). Please limit your answer to six images and 500 words.
Answer
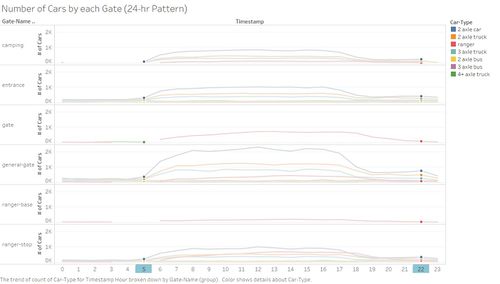
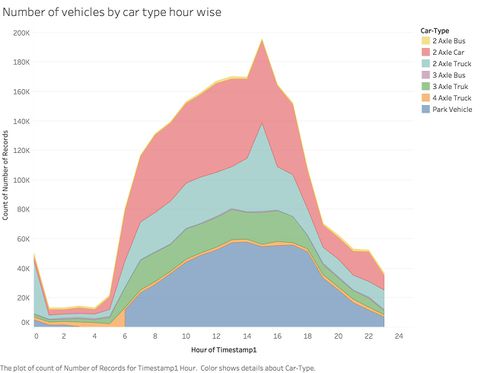
Daily hour pattern
The given visualisation shows the number of vehicles passing through each location by the daily time. It is evident that the peak traffic is between 5 am and 6pm.
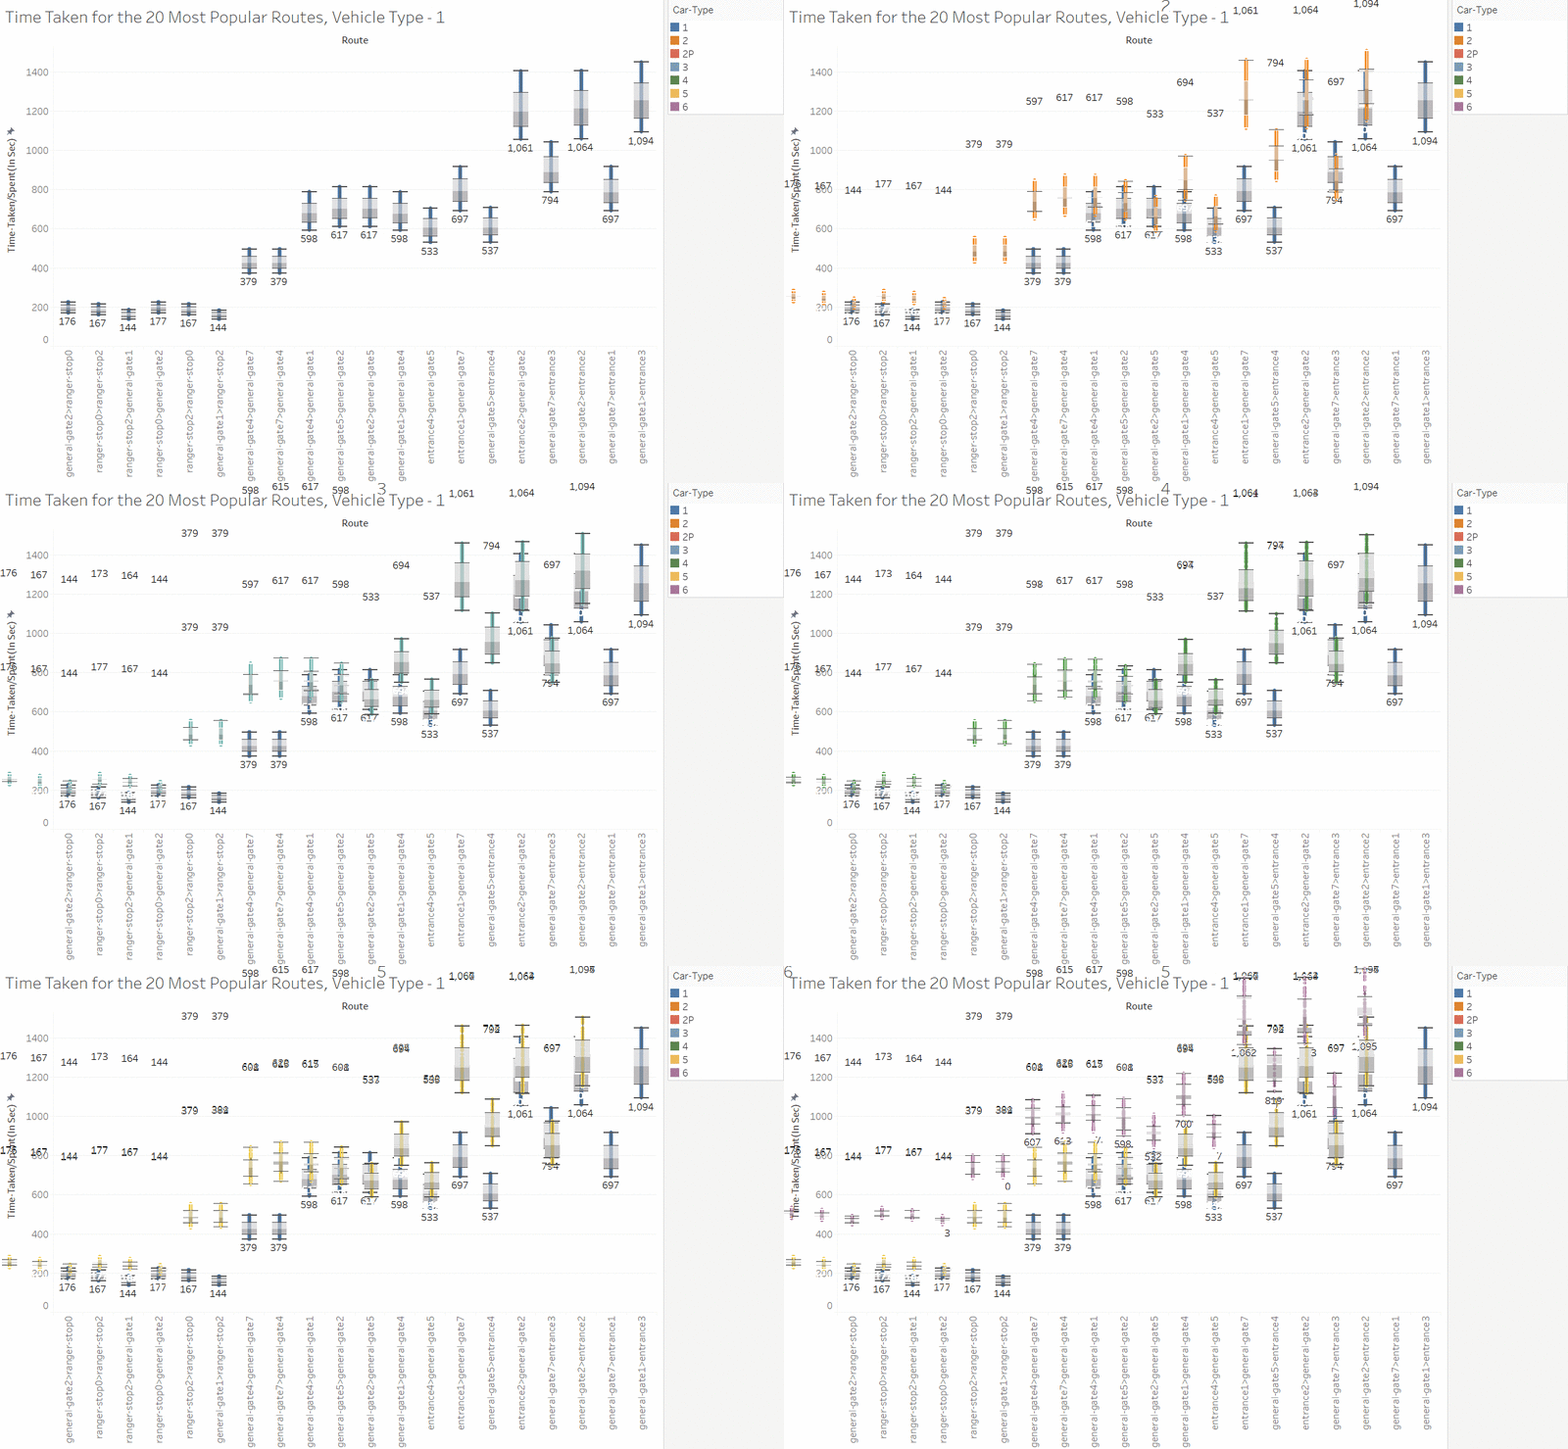
Speeding vehicles
The given visualisation shows that the minimum time taken is same for all the vehicles irrespective of the type of vehicles, so this indicates that the vehicles are speeding.
Question 2
Patterns of Life analyses may also depend on understanding what patterns appear over longer periods of time (in this case, over multiple days). Describe up to six patterns of life that occur over multiple days (including across the entire data set) by vehicles traveling through and within the park. Characterize the patterns by describing the kinds of vehicles participating, their spatial activities (where do they go?), their temporal activities (when does the pattern happen?), and provide a hypothesis of what the pattern represents (for example, many vehicles showing up at the same location each Saturday at the same time may suggest some activity occurring there each Saturday). Please limit your answer to six images and 500 words.
Answer
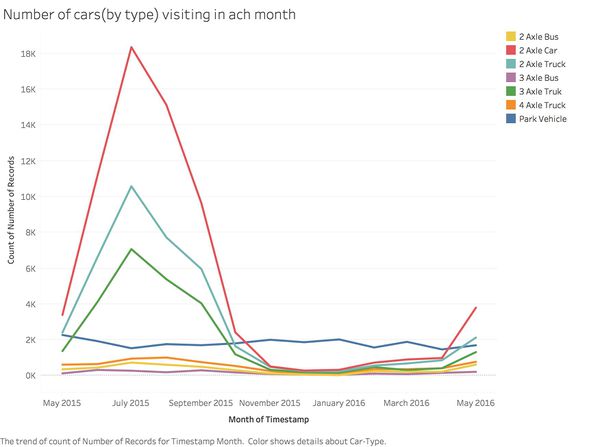
The visualisation clearly indicates that the July is the month with heavy traffic and among different vehicles, 2 axle car is in the peak during July. It can also be notified that the frequency of ranger vehicle was constant through out the given period.
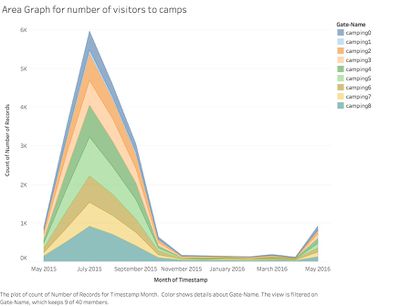
This visualisation reveals that certain campings are preferred more by the visitors during certain period of the year and there we can also see that some of the campings are rarely visited by the visitors. Campings 7 & 8 follow the kind of same trend over the year, camping 1 is the least visited with almost no activity during the whole year. Camping 4 has marked the peak time spend in January, followed by a dip in February and again a peak in march.
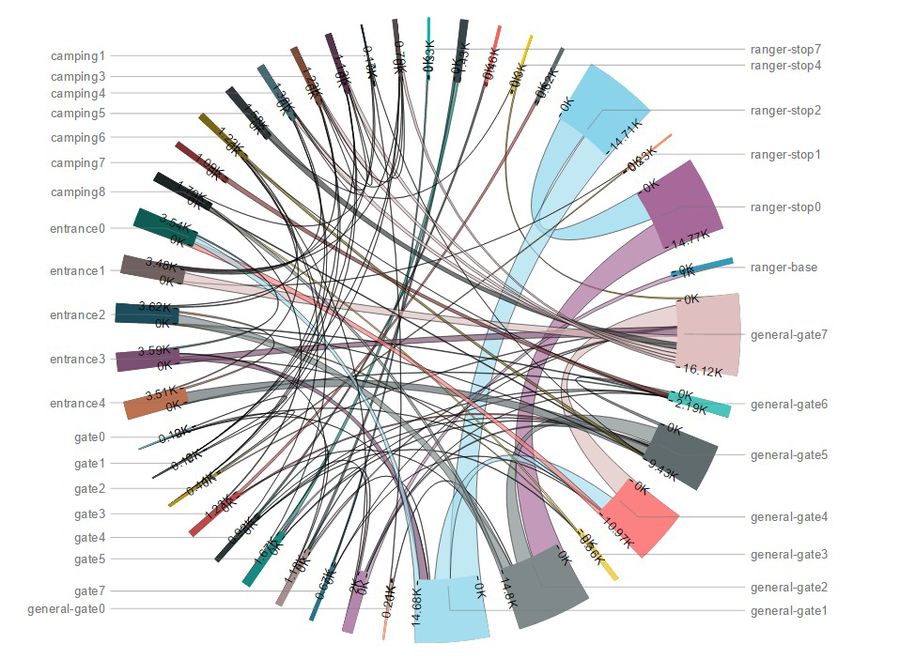
Given Chord diagram shows the movement of visitors between different locations over a period of one year.It reveals that ranger stop 1 to ranger stop 2 is the most popular route. Some other routes are: general-gate2 -> ranger-stop0 = 7490 Return - 7311
ranger-stop0 -> ranger-stop2 = 7463 Return - 7284
ranger-stop2 -> general-gate1 = 7427 Return - 7248
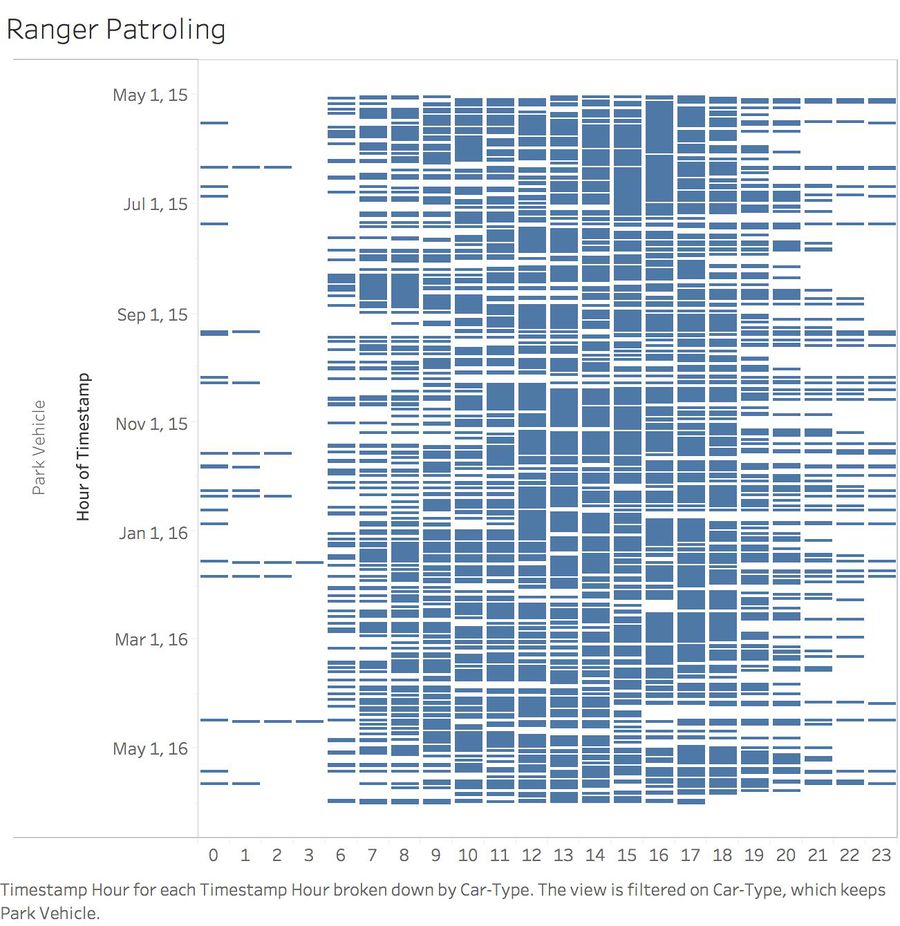
Rangers Patroling over the year by time
The given visualisation shows that the ranger patrolling is frequent during 6 am - 6 pm.
Question 3
Pattern 1
Unusual patterns may be patterns of activity that changes from an established pattern, or are just difficult to explain from what you know of a situation. Describe up to six unusual patterns (either single day or multiple days) and highlight why you find them unusual. Please limit your answer to six images and 500 words.
Answer
| Car-ID | Car Type | Number of Trips |
|---|---|---|
| 20154519024544-322 | 2 | 16 |
| 20154112014114-381 | 1 | 7 |
| 20162904122951-717 | 1 | 6 |
| 20153712013720-181 | 3 | 4 |
| 20162027042012-940 | 1 | 3 |
| 20150204100226-134 | 4 | 2 |
| 20150322080300-861 | 4 | 2 |
| 20153427103455-30 | 4 | 2 |
| 20154501084537-684 | 4 | 2 |
| 20160623090611-424 | 4 | 2 |
| 20161008061012 | 4 | 2 |
All the vehicles with these numbers have visited the preserve more than two times and is following the same route. This is an anomalous behaviour and maybe we can assume that they have some relation with the preserve like it can be a weekly patrolling police vehicle. There have been a total of 11 vehicles which made multiple trips to the park out of which the six vehicles are of type 4 which essentially means that they are 4+ axle truck or bus. These trips cannot be considered as multiple trips because the vehicles have come in for a duration of 5-6 seconds and left the park and were made to wait outside for a duration of 11-12 hours. Since it is 4+ axle vehicles, these are probably some security checking being done before entering the preserve. The vehicles of other types which made multiple trips followed the same pattern every time they visited the park.
Pattern 2
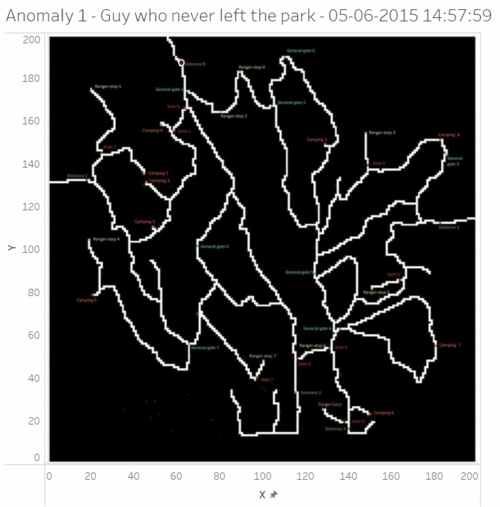
Another noticeable anomaly is that a visitor has been stuck in the preserve, maybe he is changing from one camp to another as with the crowd.
The given gif shows the movement of the guy who is stuck in the preserve. He has not left the park for 1 year, he entered the park on June 5th 2015 and the data set is till may 31 June 2016 and till that he has not left the mark. This is an anomalous behaviour and needs investigation. How he is surviving in the park is another question which can be in the scope of investigation. Probably he would be in the park with some hidden agendas and must be getting help from some of the park visitors who maybe his ally.
Pattern 3
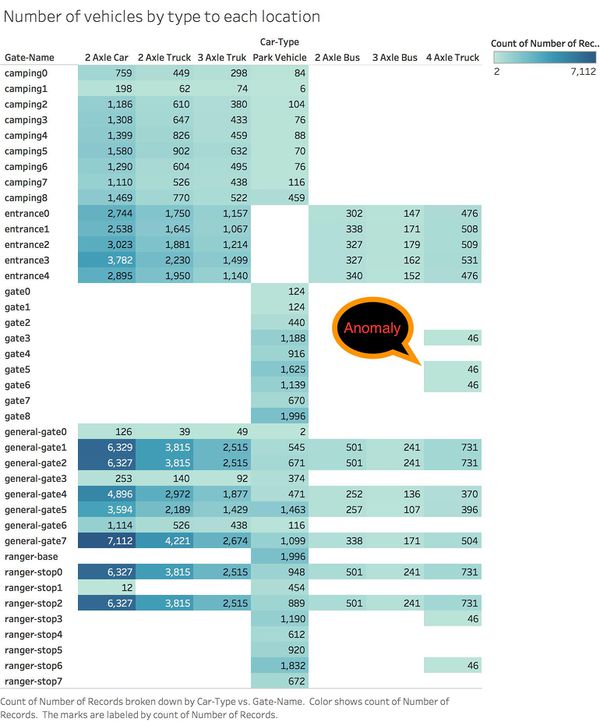
Gate 0 - 8 are only permitted to the ranger vehicles but the given visualisation reveals that some 4 axle trucks has visited these gates, whether it was permitted or a trespass is not known. Further investigation should be done on this. It should be noted that in all three gates the number of such 4 axle trucks are same (46).
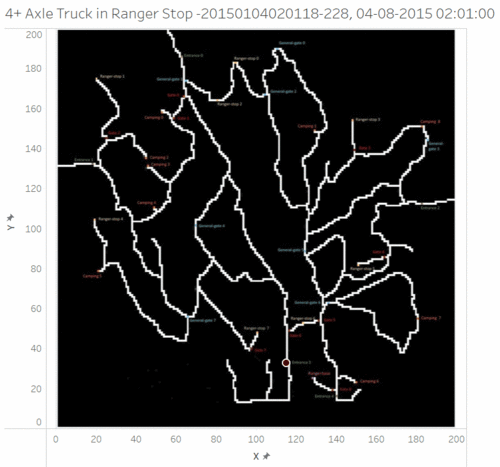
So a further analysis was done to track down the movements of these trucks and is given in the belt visualisation. The given gif shows the movement of some 4+ axle trucks moving to the ranger spots in every month, the reason for this is unknown. As it is 4 axle trucks it can be delivering something to ranger spots or can be taking something from there.
Question 4
What are the top 3 patterns you discovered that you suspect could be most impactful to bird life in the nature preserve? (Short text answer)
Answer
The top patterns observed that could most probably affect the bird life in the preserve are:
Finding 1
In certain month there are a hike in the number of camping people as well as high traffic this can disturb the natural habitat of bird life in the preserve.
Finding 2
Some of the camping spots are visited highly by visitors while some are not, for example camping 1 has the least number of visitors, so this can cause birds to move to areas nearer to camps which are less visited and therefore there will be a higher competition for food and other stuff which can affect the bird life adversely.
The given visualisation shows the number of visitors to camping sites by month and each circle shows the number of visitors in respective months which is labelled by the course
Finding 3
Vehicles with more than 2 axles can cause more air and noise pollution which will definitely affect the natural habitat of the birds.

