ISSS608 2016-17 T3 ARUNKUMAR DATA EXPLORATION
|
|
|
Contents
About Data
The data set given is the data recorded from Boonsong Lekagul Nature Preserve and a map containing locations of sensors and roadways throughout the preserve. Traffic enters and exits the preserve through official entrances. Entry gates are positioned at the Preserve entrances. Each vehicle receives an entry ticket at the gate and is assigned a vehicle class; the entry is recorded. The entry ticket contains an RF-tag that enables the Preserve sensors to pick up the passage of a vehicle through the Preserve. Each vehicle surrenders their entry ticket when exiting the Preserve and the exit is recorded. When vehicles enter the Preserve, they must proceed through a gate and obtain a pass. The gate categorizes vehicles as follows:
- 2 axle car (or motorcycle)
- 2 axle truck
- 3 axle truck
- 4 axle (and above) truck
- 2 axle bus
- 3 axle bus
Vehicles receiving a pass with a “P” appended to their category are park service vehicles that have access to all parts of the Preserve. Currently, the Preserve vehicles are only 2 axle trucks, so they are designated as “2P” vehicle type. There are five types of sensors recording data.
- Entrances. All vehicles pass through an Entrance when entering or leaving the Preserve.
- General-gates. All vehicles may pass through these gates. These sensors provide valuable information for the Preserve Rangers trying to understand the flow of traffic through the Preserve.
- Gates. These are gates that prevent general traffic from passing. Preserve Ranger vehicles have tags that allow them to pass through these gates to inspect or perform work on the roadway beyond.
- Ranger-stops. These sensors represent working areas for the Rangers, so you will often see a Ranger-stop sensor at the end of a road managed by a Gate. Some Ranger-stops are in other locations however, so these sensors record all traffic passing by.
- Camping. These sensors record visitors to the Preserve camping areas. Visitors pass by these entering and exiting a campground.
Preserve Map
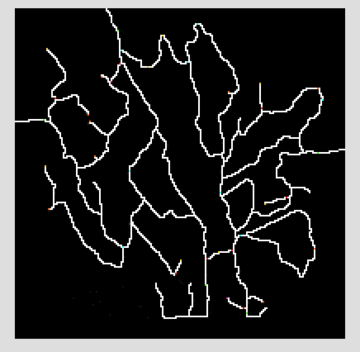
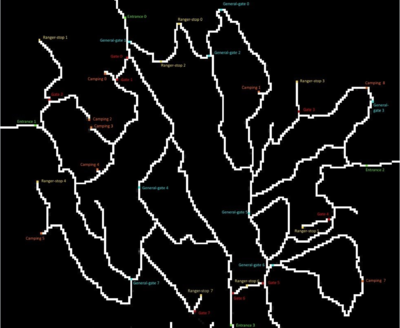
The contractors working with the Nature Preserve rangers have provided a map that presents the Preserve in terms of a 200x200 gridded area. The grid is oriented with north at the top of the map. Grid location (0,0) is at the lower left corner of the map (the SW corner). They have superimposed both the roadways and the sensor locations on this grid. The map shows an area 12 miles x 12 miles. Roadways are indicated by white colored pixels on the map. Each sensor type has its own unique color: Entrances (green), General-gates (blue), Gates (red), Ranger-stops (yellow), and Camping (orange). Other information about the dataset:
- Traffic either passes through the Preserve, stay as day campers, or stay as extended campers.
- Preserve Rangers stay at the ranger-base toward the southeast of the Preserve when they are not working in the Preserve.
- The speed limit through the Preserve is 25 mph.
- The Preserve area does not observe “Daylight Savings Time”.
The roadways traveling southward from Entrances 3 and 4 do continue to other roadways outside of the Preserve area, but these are not shown on the map. Vehicle data will not reflect travel beyond the Preserve in this direction.
Data Snippet
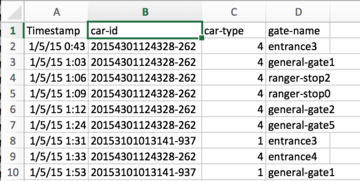
| Timestamp | car - id | car-type | gate-name |
|---|---|---|---|
| 2015-05-01 00:15:13 | 20151501121513-39 | 2 | entrance4 |
| 2015-05-01 00:32:47 | 20151501121513-39 | 2 | entrance2 |
| 2015-05-01 01:12:42 | 20151201011242-330 | 5 | entrance0 |
Data Fields
- Timestamp: the date and time the sensor reading was taken
- Car-id: the assigned car ID from the entry gate
- Car-type: Vehicle type as enumerated above. “P” is appended when it is a park vehicle.
- Gate-name: name of the sensors taking the reading. See the map.
Maps
Labelled MapData Preparation
The preliminary data given is the Timestamp, car ID, car Type and Gate name. This provides information regarding when the vehicle entered and exited the gates inside the park.
So the initial idea was to extract more information from the timestamp such as day, month, time etc as finding patters inside the data is closely connected with the time.Digging deep
As the data is about movement of different visitors it should be from one place to another place. So the next thing was to find out the location A and location B, where location A is the place from which the visitor went to the destination location B.
Following that I found out the time taken using the time stamp of these rows and changed it into seconds. This could be useful in various visualisations as the time spent can reveal many interesting patterns such as which is the spot in which the visitors has spend most time and which is the least preferred and these can lead to figuring out what is pattern between the visitors and the birds habitat in the preserve.
Followed by that I found out the gates or locations through which that particular vehicle has travelled so that we will get the path of the traveller. We can use this data to track the visitors and can found out which is the path mostly used by the visitors and can check whether there is any relation between these.
I also extracted the exact month, year, weekday and time from the time stamp as this is necessary to find out the short term and long term patterns hidden in the data set. The dataset given below is the refined dataset which I have used in most of my visualisation, I have added some reformation to this for some specific visualisation techniques but this remains as the master table for the vis.
| Serial Number | Time Stamp | Car ID | Car Type | Gate Name 1 | Gate Name 2 | Time Taken in sec | Number of Stops | Day | Year | Month | Weekday | Time |
|---|---|---|---|---|---|---|---|---|---|---|---|---|
| 01 | 1/7/2015 1:00:09 PM | 20150001010009-284 | 3 | entrance3 | general-gate1 | 1243.9999997383 | 8 | 1 | 2015 | Jul | Wed | 1:00:09 PM |


