Difference between revisions of "YunnaWei DataPreparation"
Jump to navigation
Jump to search
| Line 3: | Line 3: | ||
<p align="justify"> The given data sets are respectively a map and a csv file.</p> | <p align="justify"> The given data sets are respectively a map and a csv file.</p> | ||
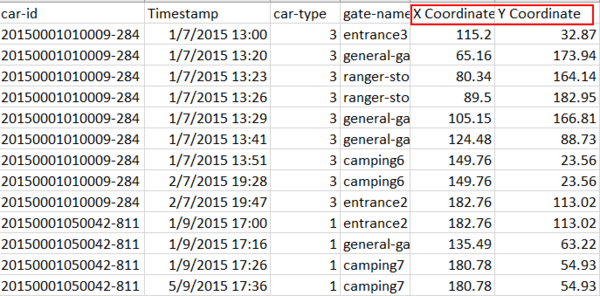
<p align="justify">For the map, it will be useful to get the coordinates of each location so that we can plot the map with traffic going through to gave a whole picture of how the traffic looks like. Tableau is used to manually label the coordinates of each location. The locations are mapped within a 200x200 sacle.</p> | <p align="justify">For the map, it will be useful to get the coordinates of each location so that we can plot the map with traffic going through to gave a whole picture of how the traffic looks like. Tableau is used to manually label the coordinates of each location. The locations are mapped within a 200x200 sacle.</p> | ||
| − | [[File:WYN Corrdinates.png|left]] | + | [[File:WYN Corrdinates.png|600 px|left]] |
Revision as of 15:08, 9 July 2017
Data Preparation
The given data sets are respectively a map and a csv file.
For the map, it will be useful to get the coordinates of each location so that we can plot the map with traffic going through to gave a whole picture of how the traffic looks like. Tableau is used to manually label the coordinates of each location. The locations are mapped within a 200x200 sacle.
