Difference between revisions of "Group 4 - Data Preparation"
Jump to navigation
Jump to search

| Line 13: | Line 13: | ||
| style="font-family:Century Gothic; font-size:100%; solid #000000; background:#2c9985; text-align:center;" width="20%" | | | style="font-family:Century Gothic; font-size:100%; solid #000000; background:#2c9985; text-align:center;" width="20%" | | ||
| − | [[Group 4 - | + | [[Group 4 - Report| <font color="#FFFFFF">Report</font>]] |
| style="font-family:Century Gothic; font-size:100%; solid #000000; background:#2c9985; text-align:center;" width="20%" | | | style="font-family:Century Gothic; font-size:100%; solid #000000; background:#2c9985; text-align:center;" width="20%" | | ||
Revision as of 21:05, 6 August 2017

ISSS608 Visual Analytics and Applications - Project
EXPLORING AND VISUALIZING SPATIO-TEMPORAL PATTERNS OF SELF-INFLICTED DEATHS IN INDIA FROM 2001-2012 USING R
Dataset Overview

The dataset – “Suicides in India” is downloaded from Kaggle uploaded by Rajanand Ilangovan. The dataset contains the suicides committed from 2001 – 2012. The structure of dataset is shown in the screenshot provided below:

The variables and their description:
| Variable | Description |
|---|---|
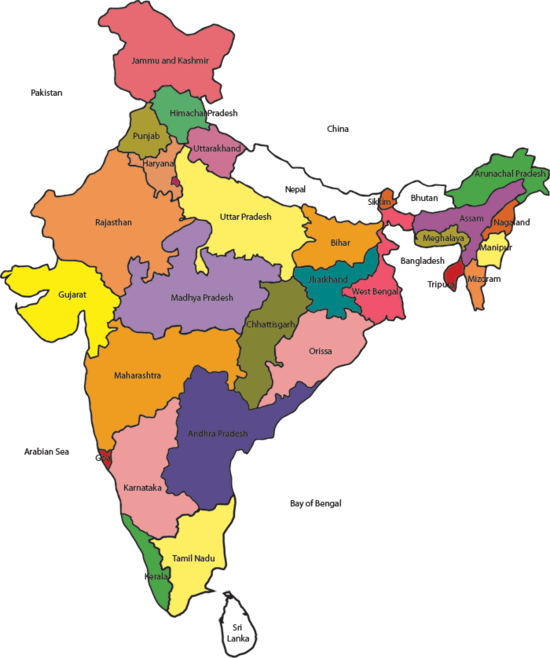
| State | Lists the 29 states and 7 union territories in India |
| Year | Shows the year ranging from 2001 – 2012 |
| Type_code | Categorizes as cause of act, means adopted, educational profile, social status and professional profile of the victim |
| Type | Describes the Type_code in detail |
| Gender | Either male or female |
| Age-group | Shows the age range of the victims |
| Total | Provides the number of victims |