Difference between revisions of "Interactive Dashboards Q3 Sumalika"
Jump to navigation
Jump to search
| Line 11: | Line 11: | ||
| style="font-family:Century Gothic; font-size:100%; solid #000000; background:#001a66; text-align:center;" width="16.6%" | | | style="font-family:Century Gothic; font-size:100%; solid #000000; background:#001a66; text-align:center;" width="16.6%" | | ||
; | ; | ||
| − | [[ | + | [[ISSS608 2016-17 T3 Assign SUMALIKA KODUMURU| <font color="#FFFFFF">Assignment Overview</font>]] |
| style="font-family:Century Gothic; font-size:100%; solid #1B338F; background:#001a66; text-align:center;" width="16.6%" | | | style="font-family:Century Gothic; font-size:100%; solid #1B338F; background:#001a66; text-align:center;" width="16.6%" | | ||
Revision as of 12:54, 16 July 2017
ISSS608: Visual Analytics and Applications
VAST CHALLENGE 2017
- SUMALIKA KODUMURU
|
|
|
|
|
|
|
|
|
|
|
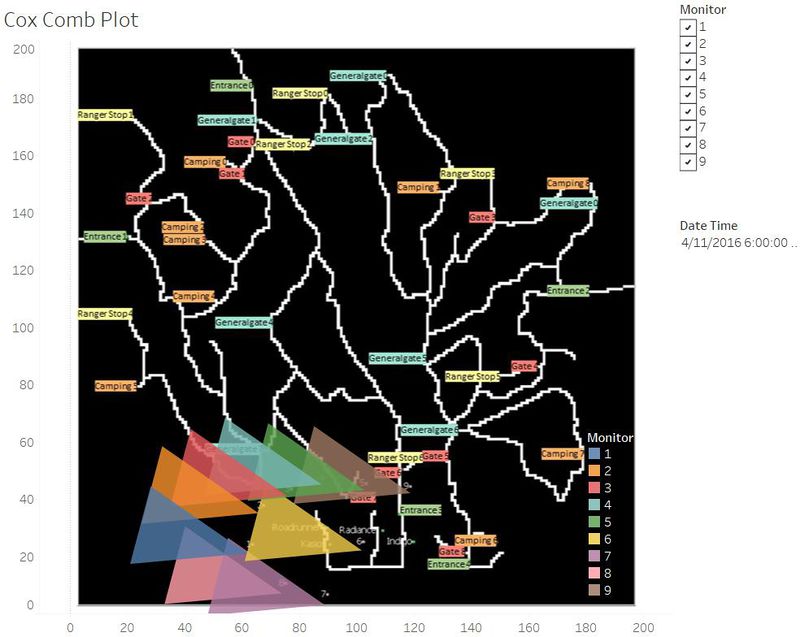
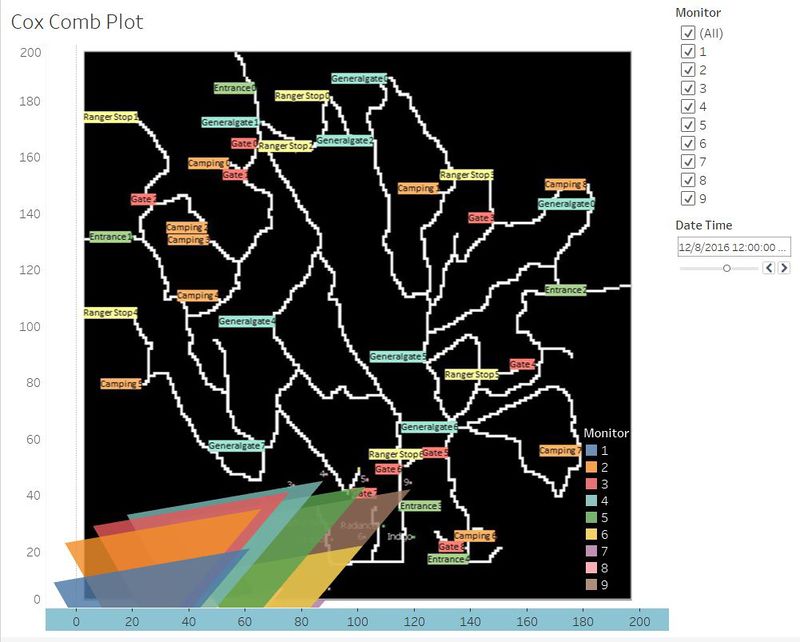
Dashboard for Chemicals Released

Dashboard 1 consists of a cox comb plot filtered on date and monitors
Interactivity:
On selecting a date, the behavior of the wind is seen with respect to every sensor. For example, on the 12th August, a reading of 84.6 is observed and the factory that is responsible for the release of the chemical is Kasios Office Furniture
