Question1 SUMALIKA KODUMURU
Sensor Performance:
ISSS608: Visual Analytics and Applications
VAST CHALLENGE 2017
- SUMALIKA KODUMURU
|
|
|
|
|
|
|
|
|
|
|
|
Analysis |
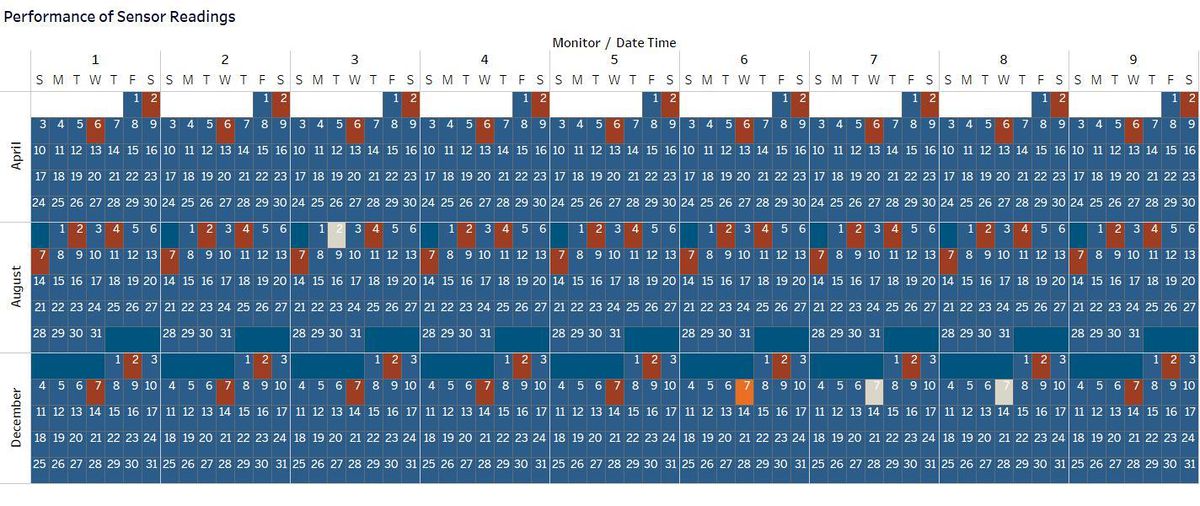
All the sensors need to capture the chemical readings at all times of the day for all the three months i.e. July, August and December.The "Calendar Plot" has dates highlighted in red indicating the days when sensors ( all 9) have failed to capture chemical readings. For example: On 2nd and 6th of April, 2nd, 4th and 7th of August and 2nd and 7th of December sensors have failed to capture the readings. Further investigation needs to be performed to make a deduction on sensor readings. At this point the sensors could have
- Incorrectly captured data
- Missed capturing data
To identify the missing data, drill down to "Hour" level to note the monitors/sensors that are responsible for these readings:
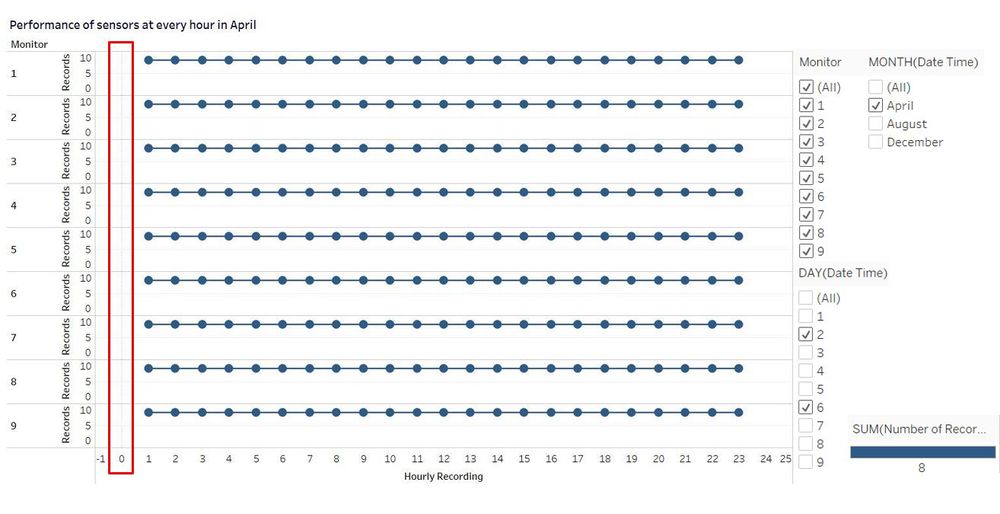
On 2nd April and 6th April, all the sensors recorded no readings at 12 AM. Either the factories were not working or have started late than their usual time and hence readings were not recorded. But when compared to the other days in this month, rest of the days have readings captured even at 12 AM and as there is no evident pattern in the operational hours of the factories,we can conclude that the sensors were not functioning well in capturing the readings on 2nd and 6th April.
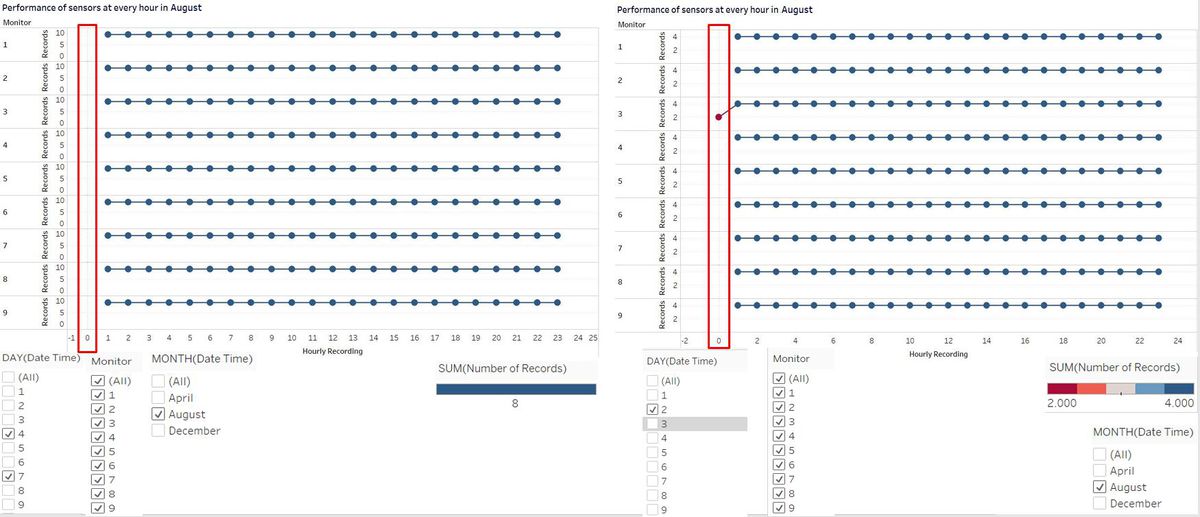
Similar to the above case in April month, on the 4th and 7th August all the sensors recorded no readings at 12 AM. However on that day at 12 AM Monitor 3 recorded activity, but instead of 4 chemicals it captured the release of two chemicals. On further investigation it was observed that AGOG-3A and Methylosmolene were the chemicals that released from factories.
This finding raises several questions such as - Were factories operating on 2nd August at 12 AM? If no then why do we see these readings?, did the sensor capture it incorrectly ? or were there any suspicious activities? Before making any conclusions, behavior of the readings needs to be analysed and hence December readings are also considered to see possible similar patterns.
Similar to the previous months, the sensors did not capture chemicals on all days at all times. On the 2nd and 7th of December, sensors missed to read chemicals at 12 AM. On further analysis it can be seen that Monitor No: 6,7,8 show readings but not all the four chemicals. Further analysis needs to be performed on the chemicals released on these particular days and identify a pattern. Overall view of how the sensors have captured the data on each day can be seen in Calendar Plot below.
Now that we identified missing data we need to check if there were any incorrectly captured data. With the help of a Heat Map it can be evidently deduced that sensors captured more of AGOG-3A and less of Methylosmolene. Two questions arise at this point:
1. Did the sensors capture the chemicals correctly?
2. Was there excess release of a certain chemical from a factory?
Two deductions can be made from the above graph:
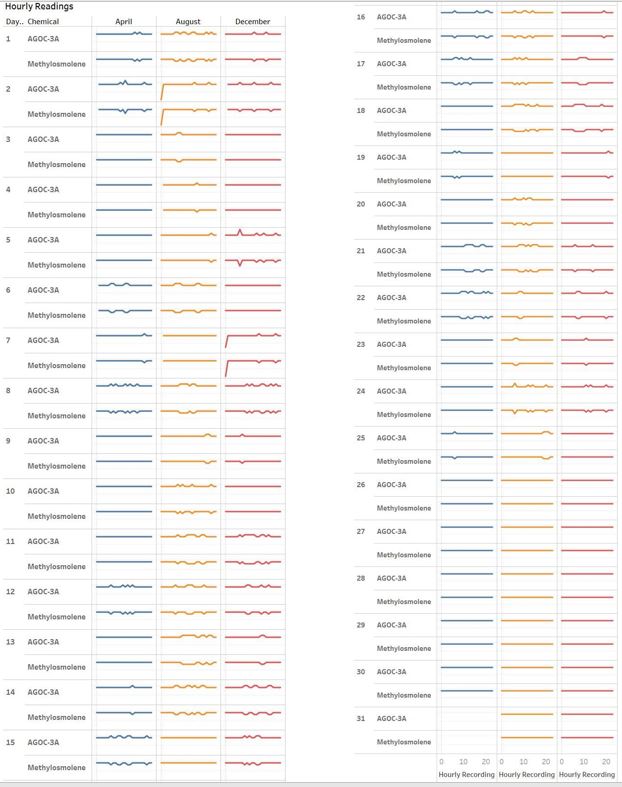
1. Apart from the days recognized above with missing data, there are other days in the month with inconsistent readings. Chemicals " Appluimonia" and " Cholorodinine" were captured consistently by the sensors and inconsistency is seen for the other two chemicals.
2. Every time there is an increase in the number of readings for AGOG-3A there is a decrease in the number of readings for Methylosmolene. This is seen clearly in the graph below.
Further investigation needs to be performed on the sensor readings for each chemical to see if there was an excess release of a certain chemical.


