Difference between revisions of "YunnaWei DataPreparation"
Jump to navigation
Jump to search
| Line 5: | Line 5: | ||
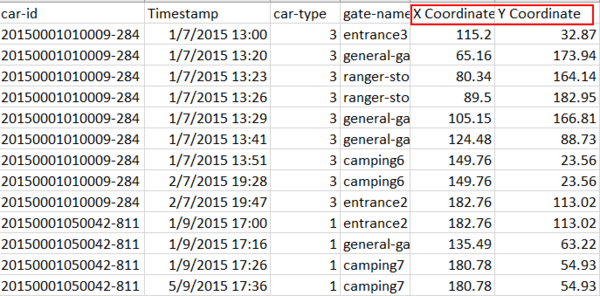
<p align="justify">For the map, it will be useful to get the coordinates of each location so that we can plot the map with traffic going through to gave a whole picture of how the traffic looks like. Tableau is used to manually label the coordinates of each location. The locations are mapped within a 200x200 sacle.</p> | <p align="justify">For the map, it will be useful to get the coordinates of each location so that we can plot the map with traffic going through to gave a whole picture of how the traffic looks like. Tableau is used to manually label the coordinates of each location. The locations are mapped within a 200x200 sacle.</p> | ||
[[File:WYN Corrdinates.png|600 px|left]] | [[File:WYN Corrdinates.png|600 px|left]] | ||
| + | |||
| + | ===Creating new variables === | ||
| + | </p align="justify">The given csv data set has the variables of Car_id, timestamp,car-type, and gate name. To find out more information about the traffic patterns, | ||
| + | new variables should be created based on the given variables.</p> | ||
| + | ==== Travelling Path ==== | ||
Revision as of 15:13, 9 July 2017
Contents
Data Preparation
The given data sets are respectively a map and a csv file.
Mapping the coordinates of each location
For the map, it will be useful to get the coordinates of each location so that we can plot the map with traffic going through to gave a whole picture of how the traffic looks like. Tableau is used to manually label the coordinates of each location. The locations are mapped within a 200x200 sacle.

Creating new variables
The given csv data set has the variables of Car_id, timestamp,car-type, and gate name. To find out more information about the traffic patterns, new variables should be created based on the given variables.