Difference between revisions of "YunnaWei PatternDetection"
Jump to navigation
Jump to search
| Line 29: | Line 29: | ||
<!--MAIN HEADER --> | <!--MAIN HEADER --> | ||
= Multiple Days Pattern = | = Multiple Days Pattern = | ||
| + | === Calendar View by Month === | ||
<div width=100%> | <div width=100%> | ||
<div width=50%> | <div width=50%> | ||
| Line 34: | Line 35: | ||
</div> | </div> | ||
<div width=50%> <font size=4> | <div width=50%> <font size=4> | ||
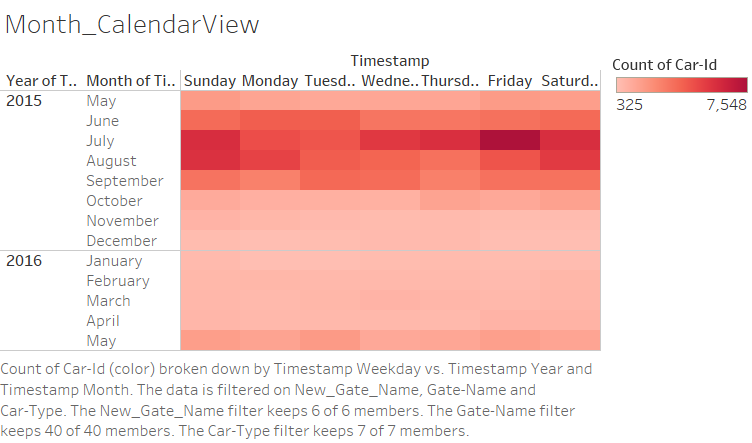
| − | <p align="justify"> the left diagram well demonstrates that there are peak and off-peak periods in terms of traffic flow in the nature reserve. It is clear that there are much more traffic during months of June, July and August and the traffic load dropped significantly after September. What's more interesting is there is almost no traffic | + | <p align="justify"> the left diagram well demonstrates that there are peak and off-peak periods in terms of traffic flow in the nature reserve. It is clear that there are much more traffic during months of June, July and August and the traffic load dropped significantly after September. What's more interesting is there is almost no traffic in months of December,January and February. |
</p> | </p> | ||
</font> | </font> | ||
</div> | </div> | ||
</div> | </div> | ||
Revision as of 19:51, 6 July 2017
Yunna Wei - ISSS608 Visual Analytics and Applications_Assignment1
|
|
|
|
|
|
Multiple Days Pattern
Calendar View by Month

the left diagram well demonstrates that there are peak and off-peak periods in terms of traffic flow in the nature reserve. It is clear that there are much more traffic during months of June, July and August and the traffic load dropped significantly after September. What's more interesting is there is almost no traffic in months of December,January and February.